Laddering Theory, Method, Analysis, and Interpretation by Thomas J. Reynolds and Jonathan Gutman is a foundational framework in qualitative research, particularly within consumer behavior studies. Below is an overview of the key aspects of this theory and methodology:
Overview of Laddering Theory
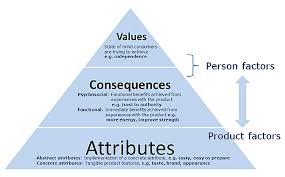
Laddering is a qualitative research technique designed to uncover the deeper motivations, values, and decision-making processes underlying consumer behavior. It is rooted in the Means-End Chain Theory, which posits that consumers make choices based on a hierarchy of perceptions involving three levels:
Attributes (A): The tangible or intangible features of a product or service.
Consequences (C): The outcomes or benefits derived from those attributes.
Values (V): The personal values or life goals that these consequences serve[1][4].
The laddering process seeks to identify the connections between these levels (A → C → V) to understand how products or services align with consumers’ personal values.
Methodology
The laddering technique involves in-depth, one-on-one interviews using a structured probing approach. The primary question format revolves around asking “Why is that important to you?” repeatedly to move from surface-level attributes to deeper values. This process creates a “ladder” of associations for each respondent[1][2][4].
Steps in Laddering:
Eliciting Attributes: Start by identifying the key features that differentiate a product or service.
Identifying Consequences: Probe to understand the benefits or outcomes associated with these attributes.
Uncovering Values: Further probe to reveal the personal values tied to these consequences.
Data Analysis
Responses are analyzed using content analysis techniques to summarize key elements at each level of abstraction (A, C, V).
Results are visualized through a Hierarchical Value Map (HVM), which graphically represents the dominant linkages across attributes, consequences, and values[1][4].
Applications
The laddering method has been widely applied in marketing and consumer research to:
Develop effective branding strategies.
Understand consumer decision-making processes.
Identify opportunities for product innovation.
It provides insights into how consumers perceive products in relation to their self-concept and life goals, enabling businesses to align their offerings with consumer values[1][2][6].
Contributions by Reynolds and Gutman
Thomas J. Reynolds: A professor and researcher specializing in strategic positioning and communication options.
Jonathan Gutman: A marketing professor focused on developing and applying Means-End Chain methodology.
Their work has been instrumental in advancing both academic and practical applications of laddering as a robust tool for understanding consumer behavior[4].
Conjoint analysis is the premier approach for optimizing product features and pricing. It mimics the trade-offs people make in the real world when making choices. In conjoint analysis surveys you offer your respondents multiple alternatives with differing features and ask which they would choose.
With the resulting data, you can predict how people would react to any number of product designs and prices. Because of this, conjoint analysis is used as the advanced tool for testing multiple features at one time when A/B testing just doesn’t cut it.
Conjoint analysis is commonly used for:
Designing and pricing products / Healthcare and medical decisions / Branding, package design, and product claims / Environmental impact studies / Needs-based market segmentation
How does conjoint analysis work?
Step 1: Break products into attributes and levels
In the picture below, a conjoint analysis example, the attributes of a car are broken down into brand, engine, type, and price. Each of those attributes has different levels.
Rather than directly ask survey respondents what they prefer in a product, or what attributes they find most important, conjoint analysis employs the more realistic context of asking respondents to evaluate potential product profiles (see below).
Step 2: Show product profiles to respondents
Each profile includes multiple conjoined product features (hence, conjoint analysis), such as price, size, and color, each with multiple levels, such as small, medium, and large.
In a conjoint exercise, respondents usually complete between 8 to 20 conjoint questions. The questions are designed carefully, using experimental design principles of independence and balance of the features.
Step 3: Quantify your market’s preferences and create a model
By independently varying the features that are shown to the respondents and observing the responses to the product profiles, the analyst can statistically deduce what product features are most desired and which attributes have the most impact on choice (see below).
Screenshot
In contrast to simpler survey research methods that directly ask respondents what they prefer or the importance of each attribute, these preferences are derived from these relatively realistic trade-off situations.
The result is usually a full set of preference scores (often called part-worth utilities) for each attribute level included in the study. The many reporting options allow you to see which segments (or even individual respondents) are most likely to prefer your product (see example table).
Why use conjoint analysis?
When people face challenging trade-offs, we learn what’s truly important to them. Conjoint analysis doesn’t allow people to say that everything is important, which can happen in typical rating scale questions, but rather forces them to choose between competing realistic options. By systematically varying product features and prices in a conjoint survey and recording how people choose, you gain information that far exceeds standard concept testing.
If you want to predict how people will react to new product formulations or prices, you cannot rely solely on existing sales data, social media content, qualitative inquiries, or expert opinion.
What-if market simulators are a key reason decision-makers embrace and continue to request conjoint analysis studies. With the model built from choices in the conjoint analysis, market simulators allow managers to test feature/pricing combinations in a simulated shopping/choice environment to predict how the market would react.
What are the outputs of Conjoint Analysis?
The preference scores that result from a conjoint analysis are called utilities. The higher the utility, the higher the preference. Although you could report utilities to others, they are not as easy to interpret as the results of market simulations that are market choices summing to 100%.
Attribute importances are another traditional output from conjoint analysis. Importances sum to 100% across attributes and reflect the relative impact each attribute has on product choices. Attribute importances can be misleading in certain cases, however, because the range of levels you choose to include in the experiment have a strong effect on the resulting importance score.
The key deliverable is the what-if market simulator. This is a decision tool that lets you test thousands of different product formulations and pricing against competition and see what buyers will likely choose. Make a change to your product or price and run the simulation again to see the effect on market choices. You can use our market simulator application or our software can export your market simulator as an Excel sheet.
How are outputs used?
Companies use conjoint analysis tools to test improvements to their product, help them set profit-maximizing prices, and to guide their development of multiple product offerings to appeal to different market segments. Because graphics may be used as attribute levels, CPG firms use conjoint analysis to help design product packaging, colors, and claims. Economists use conjoint analysis for a variety of consumer decisions involving green energy choice, healthcare, or transportation. The possibilities are endless.
The Basics of Interpreting Conjoint Utilities
Users of conjoint analysis are sometimes confused about how to interpret utilities. Difficulty most often arises in trying to compare the utility value for one level of an attribute with a utility value for one level of another attribute. It is never correct to compare a single value for one attribute with a single value from another. Instead, one must compare differences in values. The following example illustrates this point:
Brand A 40 Red 20 $ 50 90 Brand B 60 Blue 10 $ 75 40 Brand C 20 Pink 0 $ 100 0
It is not correct to say that Brand C has the same desirability as the color Red. However, it is correct to conclude that the difference in value between brands B and A (60-40 = 20) is the same as the difference in values between Red and Pink (20-0 = 20). This respondent should be indifferent between Brand A in a Red color (40+20=60) and Brand B in a Pink color (60+ 0 = 60).
< see next page >
Sometimes we want to characterize the relative importance of each attribute. We do this by considering how much difference each attribute could make in the total utility of a product. That difference is the range in the attribute’s utility values. We percentage those ranges, obtaining a set of attribute importance values that add to 100, as follows:
Screenshot
For this respondent, the importance of Brand is 26.7%, the importance of Color is 13.3%, and the importance of Price is 60%. Importances depend on the particular attribute levels chosen for the study. For example, with a narrower range of prices, Price would have been less important.
When summarizing attribute importances for groups, it is best to compute importances for respondents individually and then average them, rather than computing importances using average utilities. For example, suppose we were studying two brands, Coke and Pepsi. If half of the respondents preferred each brand, the average utilities for Coke and Pepsi would be tied, and the importance of Brand would appear to be zero!
Source:
Sawtooth Software (2021), What is conjoint analysis [online], accessed 11-10-2021, available at: https://sawtoothsoftware.com/conjoint-analysis
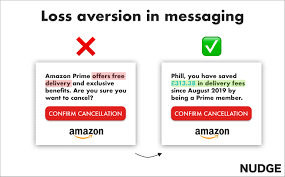
This paper explores the pervasive influence of loss aversion on marketing and commercial strategies. Loss aversion, the psychological principle that the pain of a loss is felt more strongly than the pleasure of an equivalent gain (Guttman, 2021), (Schulreich, 2020), profoundly impacts consumer decision-making. This disproportionate weighting of losses over gains significantly shapes how consumers perceive value, make choices, and respond to marketing messages. We will examine how marketers leverage this bias to influence purchasing behaviors across various contexts, moving beyond simple observations to delve into the nuanced mechanisms and ethical considerations involved. The analysis will draw upon diverse research, demonstrating the multifaceted applications of loss aversion in advertising, pricing, product design, and beyond. This exploration will not only reveal the strategic deployment of loss aversion in commercial practices but also critically analyze its ethical implications and suggest avenues for future research.
II. Theoretical Foundations of Loss Aversion
This section lays the groundwork by outlining the key theoretical frameworks underpinning loss aversion. Prospect theory (Guttman, 2021), (Schulreich, 2020), (Reisch, 2017), a cornerstone of behavioral economics developed by Kahneman and Tversky, posits that individuals make decisions based on perceived gains and losses relative to a reference point, rather than absolute outcomes. This reference point, often the status quo or an expectation, frames how individuals perceive potential outcomes. A gain of $100 feels less significant than a loss of $100, illustrating the asymmetry inherent in prospect theory. This framework provides a robust explanation for the disproportionate weight given to losses, which is central to understanding loss aversion. (Guttman, 2021) highlights the curvilinear relationship between age and loss aversion, suggesting that the impact of this bias varies across different life stages. Furthermore, (Schulreich, 2020) shows that fear can intensify loss aversion, linking amygdala activation to heightened sensitivity to potential losses. This interaction between emotion and decision-making further complicates the application of prospect theory in marketing contexts. The interaction of loss aversion with other cognitive biases, such as framing effects (Shan, 2020), (Pierce, 2020), (Grazzini, 2018), significantly amplifies its influence. Framing effects demonstrate how the presentation of information, whether emphasizing gains or losses, dramatically alters choices, even when the underlying options remain unchanged. Loss-framed messages, which highlight the potential negative consequences of inaction, are particularly potent tools in marketing (Grazzini, 2018), (Shan, 2020). The impact of risk aversion (Heilman, 2017) must also be considered in conjunction with loss aversion. While not identical, these biases often co-occur, influencing individuals to favor certain outcomes with lower uncertainty, even if the expected value of a riskier option is higher.
III. Applications of Loss Aversion in Advertising and Marketing Communications
This section delves into the practical applications of loss aversion in marketing strategies, focusing on how loss-framed messages are employed to drive consumer behavior. (Grazzini, 2018), (Shan, 2020), (Cinner, 2018) provide evidence supporting the efficacy of loss-framed appeals in various contexts. For instance, (Grazzini, 2018) demonstrates that loss-framed messages, coupled with concrete framing, significantly increase hotel guests’ engagement in recycling programs. This suggests that clearly communicating the negative consequences of not recycling (loss framing) combined with specific, actionable steps (concrete framing) creates a more compelling message. (Shan, 2020) shows that negatively framed messages regarding organic food lead to more favorable attitudes and purchase intentions than positively framed messages. This highlights the power of emphasizing potential losses to motivate environmentally conscious behavior. (Cinner, 2018) broadly advocates for leveraging cognitive biases like loss aversion to enhance the effectiveness of conservation efforts. Numerous advertising campaigns effectively utilize loss framing to increase product sales or service adoption. Consider the classic “limited-time offer,” which creates a sense of urgency and potential loss by implying that the opportunity will disappear if not acted upon immediately. This tactic directly taps into loss aversion by highlighting the potential loss of a desirable product or service. The role of scarcity appeals (Roy, 2015) is inextricably linked to loss aversion. Scarcity, suggesting limited availability, amplifies the perceived loss of not acquiring the product, further increasing purchase intentions. The interplay between scarcity and loss aversion is particularly potent in online marketing where limited-time discounts or limited-stock announcements can drive significant sales. Different media channels (e.g., print, digital, social media) can influence the effectiveness of loss-framed messages (Cinner, 2018), (Sung, 2023). The immediacy and interactive nature of digital platforms often enhance the impact of loss-framed messages compared to static print advertisements. Social media, with its emphasis on social comparison and fear of missing out (FOMO), can amplify the effectiveness of scarcity appeals (Sung, 2023), making loss-framed messaging particularly persuasive in this context.
IV. Loss Aversion and Pricing Strategies
This section investigates how loss aversion shapes pricing strategies. The impact of loss aversion is explored across various pricing techniques, including limited-time offers, price anchoring, and decoy pricing. Limited-time offers, as discussed earlier, leverage the fear of missing out to increase sales (Shan, 2020), (Roy, 2015), (Lan, 2021). The perceived scarcity and the potential loss of a good deal create a powerful incentive to purchase immediately. Price anchoring, where an initial price is presented to influence subsequent price perceptions, also exploits loss aversion. A higher initial price, even if ultimately discounted, creates a reference point against which the final price seems more favorable, mitigating the perceived loss (Shan, 2020). Decoy pricing, where a less attractive option is added to make another option seem more appealing, plays on loss aversion by highlighting the potential loss of choosing the less desirable alternative. Businesses use decoy pricing to subtly influence consumer choice, increasing the likelihood of purchases of the more expensive, but seemingly better-value option. (Lan, 2021) examines how loss aversion affects presale strategies in e-commerce, revealing that the optimal pricing strategy varies depending on consumer risk aversion and market parameters. The use of loss aversion in subscription models is crucial for customer retention (Nicolson, 2016). Subscription models often frame the loss of access to services as a significant negative consequence of canceling the subscription, incentivizing continued payments, even if the customer is not fully utilizing the service. The influence of loss aversion on pricing in different market structures, such as competitive and monopolistic markets, warrants further investigation. In competitive markets, the strategic use of loss aversion might be more limited due to the pressure to match competitor prices. Monopolistic markets, however, offer greater scope for manipulating consumer perceptions of value and exploiting loss aversion for profit maximization.
V. Loss Aversion in Product Design and Development
This section examines how manufacturers and designers leverage loss aversion in creating products and services. The impact of loss aversion extends beyond marketing messages to the design of products themselves. Product features, packaging, and warranties are all potential avenues for exploiting loss aversion. Consider product warranties: A longer warranty can mitigate the perceived risk of purchasing a product, reducing the fear of loss associated with potential malfunctions or defects. This reduction in perceived risk can increase sales, particularly for high-value items. Packaging can also play a role; Luxurious packaging can enhance the perceived value of a product, making the potential loss of not owning it more significant (Wahyono, 2021), (King, 2017). The endowment effect (Wahyono, 2021), (King, 2017), where consumers place a higher value on something they already possess, has significant implications for product design and marketing. This suggests that strategies that allow consumers to “try before they buy” or experience the product firsthand can increase sales by creating a sense of ownership and, thus, increasing the perceived loss associated with not making the purchase. The influence of loss aversion on customer satisfaction and loyalty is also crucial. Products designed with a focus on minimizing potential negative experiences (e.g., easy returns, reliable functionality) can reduce the likelihood of customer dissatisfaction and increase loyalty. This reduces the perceived risk of loss associated with the purchase, fostering positive customer relationships. Improving customer experience through product design is an important application of loss aversion. By anticipating potential points of frustration and designing features to mitigate those issues, businesses can reduce the negative feelings associated with product use, further enhancing customer satisfaction and loyalty.
VI. Ethical Considerations and Future Research Directions
This section addresses the ethical implications of exploiting loss aversion in marketing. While the strategic use of loss aversion can be effective, it also raises ethical concerns about manipulation and potential harm to consumers (Heilman, 2017), (Cinner, 2018), (Pierce, 2020). The line between persuasive marketing and manipulative tactics is often blurred, necessitating a careful consideration of ethical boundaries. (Heilman, 2017) highlights the negative impact of loss-framed messages in organ donation, suggesting that emphasizing potential regulatory sanctions can lead to increased organ discard rates. This example underscores the potential for loss aversion-based marketing to have unintended consequences. (Cinner, 2018) calls for a more ethical approach to conservation marketing, advocating for strategies that empower individuals rather than simply manipulating them. (Pierce, 2020) demonstrates the negative consequences of loss-framed performance incentives, showing that prepayment, intended to motivate employees, can lead to decreased productivity. This finding challenges the conventional wisdom surrounding the desirability of loss-framed incentives. The potential for regulations to mitigate undue influence should be explored. Government regulations could play a crucial role in ensuring that marketing practices utilizing loss aversion remain within ethical bounds. This could involve stricter regulations on misleading advertising, clearer labeling requirements, or even limitations on certain marketing techniques. Future research should investigate the nuances of loss aversion across different cultures and populations. Cross-cultural studies can illuminate the variability of loss aversion and its responsiveness to different marketing strategies. This will lead to a more nuanced understanding of how to apply loss aversion ethically and effectively. Further research is also needed to understand the long-term effects of loss aversion-based marketing strategies. The cumulative impact of repeated exposure to loss-framed messages on consumer behavior requires further investigation. This research could inform the development of more ethical and sustainable marketing practices.
VII Navigating the Landscape of Loss Aversion in Marketing
loss aversion plays a significant and multifaceted role in shaping consumer behavior and influencing marketing strategies. Marketers effectively leverage this psychological bias to drive sales and enhance profitability. However, the ethical considerations and potential for consumer manipulation necessitate a balanced approach. While loss aversion provides a powerful tool for influencing consumer decisions, its ethical application requires careful consideration. The potential for manipulation and the need to respect consumer autonomy must be paramount. Further research is needed to fully understand the nuances of loss aversion across various contexts and to develop ethical guidelines for its responsible application in marketing and advertising. This includes exploring the interaction of loss aversion with other cognitive biases, investigating its effectiveness across different cultures, and assessing its long-term impact on consumer behavior. By integrating insights from behavioral economics and ethics, marketers can harness the power of loss aversion while upholding responsible and sustainable business practices. The studies reviewed herein provide a robust foundation for future investigations into the complex interplay between psychology, ethics, and marketing. The continued exploration of this relationship will ultimately lead to more effective and ethical marketing strategies.
References
Guttman, Z., Ghahremani, D., Pochon, J., Dean, A., & London, E. (2021). Age influences loss aversion through effects on posterior cingulate cortical thickness. Frontiers in Neuroscience. https://doi.org/10.3389/fnins.2021.673106
Schulreich, S., Gerhardt, H., Meshi, D., & Heekeren, H. (2020). Fear-induced increases in loss aversion are linked to increased neural negative-value coding. Social Cognitive and Affective Neuroscience. https://doi.org/10.1093/scan/nsaa091
Reisch, L. A. & Zhao, M. (2017). Behavioural economics, consumer behaviour and consumer policy: state of the art. Cambridge University Press. https://doi.org/10.1017/bpp.2017.
Shan, L., Diao, H., & Wu, L. (2020). Influence of the framing effect, anchoring effect, and knowledge on consumers attitude and purchase intention of organic food. Frontiers Media. https://doi.org/10.3389/fpsyg.2020.02022
Pierce, L., Rees-Jones, A., & Blank, C. (2020). The negative consequences of loss-framed performance incentives. None. https://doi.org/10.3386/w26619
Grazzini, L., Rodrigo, P., Aiello, G., & Viglia, G. (2018). Loss or gain? the role of message framing in hotel guests recycling behaviour. Taylor & Francis. https://doi.org/10.1080/09669582.2018.1526294
Heilman, R., Green, E., Reddy, K., Moss, A., & Kaplan, B. (2017). Potential impact of risk and loss aversion on the process of accepting kidneys for transplantation. Transplantation. https://doi.org/10.1097/TP.0000000000001715
Cinner, J. E. (2018). How behavioral science can help conservation. American Association for the Advancement of Science. https://doi.org/10.1126/science.aau6028
Roy, R. & Sharma, P. (2015). Scarcity appeal in advertising: exploring the moderating roles of need for uniqueness and message framing. Taylor & Francis. https://doi.org/10.1080/00913367.2015.1018459
Sung, E., Kwon, O., & Sohn, K. (2023). Nft luxury brand marketing in the metaverse: leveraging blockchaincertified nfts to drive consumer behavior. Wiley. https://doi.org/10.1002/mar.21854
Lan, C. & Jianfeng, Z. (2021). New product presale strategies considering consumers loss aversion in the e-commerce supply chain. Hindawi Publishing Corporation. https://doi.org/10.1155/2021/8194879
Nicolson, M., Huebner, G., & Shipworth, D. (2016). Are consumers willing to switch to smart time of use electricity tariffs? the importance of loss-aversion and electric vehicle ownership. Elsevier BV. https://doi.org/10.1016/j.erss.2016.12.001
Wahyono, H., Narmaditya, B. S., Wibowo, A., & Kustiandi, J. (2021). Irrationality and economic morality of smes behavior during the covid-19 pandemic: lesson from indonesia. Elsevier BV. https://doi.org/10.1016/j.heliyon.2021.e07400
King, D. & Devasagayam, R. (2017). An endowment, commodity, and prospect theory perspective on consumer hoarding behavior. None. https://doi.org/10.22158/jbtp.v5n2p77
The Trade Desk’s Surprising Move into the TV OS World: What Media Students Need to Know
In a surprising turn of events, digital advertising giant The Trade Desk (TTD) is rumored to be entering the TV operating system (OS) ecosystem[1]. This move has significant implications for the media landscape and raises important questions for future media professionals. Here’s what media students should understand about this development:
Background
The Trade Desk, founded in 2009, is a major player in the digital advertising world. It operates an omnichannel platform that allows advertisers to buy ad placements across various digital channels, including Connected TV (CTV)[1]. In 2023, TTD reported revenue of $1.9 billion and claims to reach over 90 million households globally[1].
The Move into TV OS
According to industry newsletter Lowpass, The Trade Desk began working on its own CTV system as early as 2020. Their first partner is rumored to be audio device manufacturer Sonos, with plans to launch a TV set-top box[1].
Key Points for Discussion
Data Acquisition Strategy TTD’s primary motivation appears to be gaining access to first-party data. By creating their own TV OS, they can build direct consumer relationships and collect valuable data on viewing habits and behaviors[1]. This raises questions about data privacy and the increasing value of user information in the media industry.
Vertical Integration in Advertising This move represents a significant shift for TTD, positioning them higher in the advertising value chain. It allows them to be not just a buyer and seller of ad space, but also a content platform[1]. Students should consider the implications of such vertical integration on market competition and advertising dynamics.
Challenges in Scaling a New TV OS Entering the TV OS market is no small feat. TTD will face significant challenges in building an app ecosystem, securing content partnerships, and achieving meaningful market share[1]. Media students should analyze the strategies required to succeed in this highly competitive space.
Impact on “Open Internet” Positioning The Trade Desk has long positioned itself as a champion of the “Open Internet” in contrast to “walled gardens” like Google and Facebook[1]. How does this move into creating a proprietary TV OS align with or contradict this stance? This presents an interesting case study in corporate messaging and strategy.
Future of Advertising Platforms TTD’s entry into the TV OS world may be a defensive move against existing platforms developing their own ad-selling capabilities[1]. Students should consider how this trend might reshape the advertising technology landscape and what it means for future media professionals.
Additional Context
To fully grasp the significance of this development, media students should also familiarize themselves with:
The current TV OS landscape, including major players like Roku, Amazon Fire TV, and Google TV.
The growth of Connected TV advertising, which eMarketer projects will reach $26.92 billion in the US by 2025.
The ongoing shift from traditional TV to streaming platforms and its impact on advertising strategies.
The importance of first-party data in the era of increasing privacy regulations and the phasing out of third-party cookies.
By examining The Trade Desk’s bold move into the TV OS space, media students can gain valuable insights into the evolving relationships between technology, content, and advertising in the digital age.
10 research ideas for media students based on The Trade Desk’s move into the TV OS world
The impact of vertical integration in the digital advertising ecosystem on market competition and innovation.
Fulgoni, G. M. (2018). How to maximize the return on investment from digital marketing. Journal of Advertising Research, 58(2), 146-148. https://doi.org/10.2501/JAR-2018-025
Privacy implications of first-party data collection through proprietary TV operating systems.
Schneider, M. J., Jagpal, S., Gupta, S., Li, S., & Yu, Y. (2017). Protecting customer privacy when marketing with second-party data. International Journal of Research in Marketing, 34(3), 593-603. https://doi.org/10.1016/j.ijresmar.2017.02.003
The evolution of Connected TV advertising: Challenges and opportunities for advertisers and publishers.
Malthouse, E. C., Maslowska, E., & Franks, J. U. (2018). Understanding programmatic TV advertising. International Journal of Advertising, 37(5), 769-784. https://doi.org/10.1080/02650487.2018.1461733
Strategies for new entrants to compete with established players in the TV OS market.
Gawer, A., & Cusumano, M. A. (2014). Industry platforms and ecosystem innovation. Journal of Product Innovation Management, 31(3), 417-433. https://doi.org/10.1111/jpim.12105
The role of data-driven personalization in enhancing viewer experience and ad effectiveness in streaming platforms.
Tran, G. A., & Strutton, D. (2020). Comparing email and SNS users: Investigating e-servicescape, customer reviews, trust, loyalty and E-WOM. Journal of Retailing and Consumer Services, 53, 101782. https://doi.org/10.1016/j.jretconser.2019.03.009
The potential impact of ad tech companies entering the content distribution space on traditional media companies.
Ethical considerations in the convergence of advertising technology and content platforms.
Boerman, S. C., Kruikemeier, S., & Borgesius, F. J. Z. (2017). Online behavioral advertising: A literature review and research agenda. Journal of Advertising, 46(3), 363-376. https://doi.org/10.1080/00913367.2017.1339368
The future of audience measurement and attribution in a fragmented TV ecosystem.
Napoli, P. M. (2011). Audience evolution: New technologies and the transformation of media audiences. Columbia University Press.
The role of artificial intelligence and machine learning in optimizing ad placement and targeting in connected TV environments.
Chen, Y., & Yao, S. (2017). Sequential search with refinement: Model and application with click-stream data. Management Science, 63(12), 4345-4365. https://doi.org/10.1287/mnsc.2016.2557
The potential impact of ad tech companies’ TV OS initiatives on net neutrality and content diversity.
Wu, T. (2003). Network neutrality, broadband discrimination. Journal on Telecommunications and High Technology Law, 2, 141.
These research ideas cover various aspects of The Trade Desk’s move into the TV OS world, including its implications for advertising, privacy, competition, and content distribution. The additional scientific sources provide a foundation for further exploration of these topics.


Geef een reactie
Je moet ingelogd zijn op om een reactie te plaatsen.