

Introduction
In data analysis, especially within the social and media sciences, researchers often confront datasets composed of variables that operate on entirely different scales. Audience reach may be expressed in millions of viewers, engagement rates in percentages, and emotional responses in numerical ratings from survey scales. Comparing or combining such variables without a common frame of reference can lead to misleading interpretations. One of the most powerful statistical techniques to address this challenge is standardization through z-scores.
Z-scores, sometimes referred to as standard scores, transform raw data into a standardized metric indicating how far and in which direction a data point deviates from its distribution’s mean, measured in units of standard deviation (Field, 2021). This transformation not only allows for direct comparability between different datasets but also forms the foundation for a broad range of statistical analyses, including correlation, regression, and hypothesis testing.
This blog post explains the conceptual basis of z-scores, discusses their analytical advantages, and illustrates their use with an example drawn from media studies research — specifically, audience engagement analysis across multiple social media platforms.
The Concept of Z-Scores
At its core, the z-score represents the position of an observation within a distribution. It is computed as:
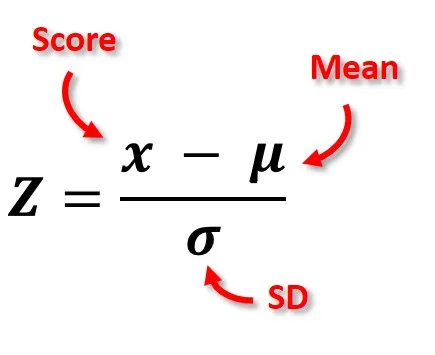
where X is the observed value, \mu the mean of the distribution, and sigma the standard deviation (Gravetter & Wallnau, 2020).
This transformation re-expresses data so that the new distribution has a mean of 0 and a standard deviation of 1. In other words, after standardization, all variables — regardless of their original units — share a common scale.
A positive z-score indicates a value above the mean, a negative one indicates a value below the mean, and the absolute magnitude reflects how far away it lies in terms of standard deviations. For example, a z-score of +2 means that a score is two standard deviations above the mean, placing it among the top 2.5% of the distribution in a normal curve.
This statistical simplicity hides a profound conceptual advantage: z-scores make contextual interpretation possible even across variables that originally had no meaningful comparison.
Why Standardization Matters in Data Analysis
The need for standardization becomes evident when data variables differ in units, ranges, or variance. Without standardization, large-scale variables may dominate smaller-scale ones in multivariate analysis, leading to distorted or biased outcomes (Tabachnick & Fidell, 2019).
For instance, imagine a dataset containing both “average viewing time in minutes” and “viewer satisfaction on a 1–10 scale.” The raw scales are incomparable: a one-unit increase in minutes does not equate to a one-unit increase in satisfaction. Z-scores solve this by eliminating units and expressing both variables relative to their means and variances.
In this standardized form, each data point reflects its relative position within its own distribution, allowing direct comparison and the integration of heterogeneous data into a single analytical framework.
Advantages of Using Z-Scores
1. Comparability Across Different Metrics
The primary advantage of z-scores is that they allow researchers to compare values that come from different scales or even different populations. For example, in media analytics, engagement data on TikTok, YouTube, and Instagram may have vastly different average interaction levels and variances. A z-score transformation allows analysts to compare relative performance rather than raw numbers.
This comparability is essential in contexts such as cross-platform performance evaluation, where absolute metrics (likes, shares, views) are less meaningful than standardized deviations from each platform’s average engagement (Keller, 2022).
2. Identification of Outliers
Z-scores provide a direct method for detecting outliers — data points that lie far from the mean. In standardized data, scores beyond ±3 are typically considered unusual or extreme. Identifying such points is crucial in data cleaning, error detection, or when investigating exceptional cases (e.g., a viral post that greatly exceeds normal engagement).
3. Facilitating Normal Distribution Analysis
Many inferential statistical techniques assume normality. By converting variables to z-scores, researchers can map data directly onto the standard normal distribution, enabling straightforward calculation of probabilities and percentiles. This property is foundational for hypothesis testing, confidence intervals, and determining statistical significance.
4. Enhancing Regression and Machine Learning Models
In multivariate contexts such as regression or machine learning, z-scores improve numerical stability and interpretability. Standardizing predictors ensures that coefficients represent comparable scales of effect and that optimization algorithms converge efficiently (James, Witten, Hastie, & Tibshirani, 2023).
5. Equity and Interpretability in Media Analytics
In media and communication research, comparing channels or audience segments often involves balancing variables that are inherently unequal — follower counts, impressions, or content types. Z-scores provide an equitable framework that translates these into a shared metric, reducing bias and improving interpretability when communicating findings to non-technical stakeholders.
A Media-Related Example: Comparing Engagement Across Platforms
To illustrate, consider a media researcher analyzing the engagement performance of short-form videos posted by a news organization across three platforms: TikTok, Instagram Reels, and YouTube Shorts. The goal is to identify which platform generates the strongest audience engagement relative to each platform’s own norms.
Step 1: Collecting Data
Suppose the researcher gathers the following metrics for each video:
- Views (in thousands)
- Likes (count)
- Average watch duration (in seconds)
Raw data from these platforms are not directly comparable: TikTok typically yields higher view counts but shorter watch durations; YouTube has fewer views but longer engagement times.
Step 2: Standardizing with Z-Scores
To make comparisons meaningful, the researcher computes z-scores for each metric within each platform. The resulting z-score represents how a particular video performs relative to the average video on that platform.
For instance:
- A TikTok video with a z-score of +2.1 in likes means it performs significantly better than most TikTok videos.
- An Instagram video with a z-score of −1.2 in watch duration performs worse than average for Instagram.
After standardization, the researcher can combine these standardized metrics into a composite engagement index (e.g., by averaging z-scores across metrics).
Step 3: Interpreting the Results
This analysis reveals which videos are relatively strong performers within their own platforms and which outperform expectations across platforms. A video that achieves high positive z-scores consistently across all platforms can be considered universally engaging content, while one with platform-specific success might reveal contextual audience preferences.
This z-score-based approach thus supports comparative analysis without distorting scale differences, allowing researchers to draw fairer and more interpretable conclusions about cross-platform media performance.
The Broader Implications for Media and Communication Research
Z-scores are not merely a statistical convenience; they represent a methodological principle of contextual equivalence. Media scholars increasingly encounter “big data” environments where metrics are heterogeneous — likes, retweets, view durations, or sentiment scores all coexist within complex datasets (Napoli, 2019). Standardization through z-scores enables a coherent analytical language that makes such multidimensional data tractable.
Moreover, z-scores align with the epistemological goals of media research: understanding relative phenomena rather than absolute quantities. Engagement, influence, or attention are inherently comparative constructs — one post garners “more” engagement than another, one influencer performs “better” than peers. Standardization captures these relational dimensions quantitatively, reflecting the comparative nature of media dynamics.
From a pedagogical perspective, introducing z-scores early in statistical education helps students move beyond rote computation toward conceptual reasoning. It reinforces the idea that statistical meaning emerges from context — that a raw score’s value is inseparable from the distribution to which it belongs.
Z-Scores and Inferential Statistics
The utility of z-scores extends beyond descriptive analysis into inferential statistics. When a population is normally distributed, z-scores directly correspond to probabilities:
- A z-score of 0 corresponds to the 50th percentile.
- A z-score of +1 corresponds to approximately the 84th percentile.
- A z-score of −1 corresponds to approximately the 16th percentile.
This mapping allows researchers to test hypotheses about sample means or individual observations relative to population expectations. In media research, this might involve testing whether an advertisement’s recall score significantly exceeds the industry average, or whether a specific campaign’s engagement lies within the expected variability range.
For example, if the mean engagement rate for online news videos is 3.5% (SD = 1.2%), and a specific video achieves 6%, its z-score would be:
z = \frac{6 – 3.5}{1.2} = 2.08
This result places the video above 98% of all comparable content — an easily interpretable, probabilistic statement grounded in the standard normal distribution.
Integrating Z-Scores with Modern Data Analysis Techniques
In modern analytics environments — including data dashboards, AI-based recommendation systems, and predictive modeling — z-scores remain foundational. Many machine learning algorithms implicitly rely on feature standardization to ensure balanced weighting among input variables. For example, in sentiment analysis of user comments, standardizing word frequency scores ensures that no individual feature dominates due to scale differences.
In media analytics platforms, z-scores can enhance dashboards by visualizing relative performance rather than raw values. A chart showing z-scores of engagement or sentiment provides an intuitive signal of whether a piece of content performs “above average,” “average,” or “below average,” independent of platform-specific scale effects.
This relative framing aligns with how human audiences interpret performance: people understand “better than average” more naturally than “5.3% engagement.” Thus, z-scores bridge quantitative rigor with interpretive clarity — a rare combination valuable for both researchers and practitioners.
Limitations and Responsible Use
While z-scores are powerful, they must be applied carefully. They assume underlying distributions that are roughly normal; in heavily skewed or bounded data (common in media analytics, such as likes or views), extreme values can distort the mean and standard deviation. In such cases, researchers may use robust standardization or transform data (e.g., via logarithms) before computing z-scores (Field, 2021).
Additionally, z-scores provide relative interpretation — they describe how unusual a score is within its distribution but not why. A high z-score in engagement could stem from a viral event, algorithmic amplification, or data errors. Thus, z-scores should be treated as diagnostic tools, guiding deeper interpretation rather than providing definitive explanations.
Educational Perspective: Teaching Z-Scores in Media Studies
For students in media and communication programs, understanding z-scores is a gateway to quantitative literacy. The concept concretely illustrates statistical reasoning about variation and context. Teaching z-scores through media examples — such as analyzing differences in follower counts or video retention rates — connects abstract mathematics to real-world interpretation.
In classrooms, visualizing z-scores on a standard normal curve helps students intuitively grasp the meaning of “above average” or “two standard deviations below.” Incorporating practical assignments where students standardize social media metrics encourages them to think critically about comparability, fairness, and statistical bias — essential competencies in contemporary media research.
References
Field, A. (2021). Discovering statistics using IBM SPSS statistics (6th ed.). Sage Publications.
Gravetter, F. J., & Wallnau, L. B. (2020). Statistics for the behavioral sciences (11th ed.). Cengage Learning.
James, G., Witten, D., Hastie, T., & Tibshirani, R. (2023). An introduction to statistical learning: With applications in R (3rd ed.). Springer.
Keller, M. (2022). Cross-platform analytics in digital media research. Routledge.
Napoli, P. M. (2019). Social media and the public interest: Media regulation in the disinformation age. Columbia University Press.
Tabachnick, B. G., & Fidell, L. S. (2019). Using multivariate statistics (7th ed.). Pearson.