Tag: Research General

  • Theories, Models and Concepts

    Theories, Models, and Concepts in Media and Marketing

    In the realm of media and marketing, understanding theories, models, and concepts is crucial for developing effective strategies. These constructs provide a framework for analyzing consumer behavior, crafting strategies, and implementing marketing campaigns. This essay will explore each construct with examples to illustrate their application.

    Theories

    Definition: Theories in marketing and media are systematic explanations of phenomena that predict how certain variables interact. They help marketers understand consumer behavior and the effectiveness of different strategies.

    Example: Maslow’s Hierarchy of Needs

    • Theory: Maslow’s Hierarchy of Needs is a psychological theory that suggests human actions are motivated by a progression of needs, from basic physiological requirements to self-actualization[3].
    • Model: In marketing, this theory is modeled by identifying which level of need a product or service satisfies. For example, a luxury car brand might focus on self-esteem needs by promoting exclusivity and status.
    • Concept: The concept derived from this model is “status marketing,” where products are marketed as symbols of success and achievement to appeal to consumers seeking self-esteem fulfillment.

    Models

    Definition: Models are simplified representations of reality that help marketers visualize complex processes and make predictions. They often serve as tools for strategic planning.

    Example: AIDA Model

    • Theory: The AIDA model is based on the theory that consumers go through four stages before making a purchase: Attention, Interest, Desire, and Action[2].
    • Model: This model guides marketers in structuring their advertising campaigns to first capture attention with striking visuals or headlines, then build interest with engaging content, create desire by highlighting benefits, and finally prompt action with clear calls to action.
    • Concept: The concept here is “customer journey mapping,” where marketers design each stage of interaction to lead the consumer smoothly from awareness to purchase.

    Concepts

    Definition: Concepts are ideas or mental constructs that arise from theories and models. They provide actionable insights or strategies for marketers.

    Example: Content Marketing

    • Theory: Content marketing is grounded in the theory that providing valuable content builds brand awareness and trust among consumers[2].
    • Model: A content marketing model involves creating a mix of informative blogs, engaging videos, and interactive social media posts to attract and retain an audience.
    • Concept: The concept derived from this model is “brand storytelling,” where brands use narratives to connect emotionally with their audience, fostering loyalty and engagement.

    In the realm of media and marketing, understanding theories, models, and concepts is crucial for developing effective strategies. These constructs provide a framework for analyzing consumer behavior, crafting strategies, and implementing marketing campaigns. This essay will explore each construct with examples to illustrate their application.

  • Introduction into Statistics ( Chapter 2 and 3)

    Howitt and Cramer Chapter 2 and 3
    Variables, concepts, and models form the foundation of scientific research, providing researchers with the tools to investigate complex phenomena and draw meaningful conclusions. This essay will explore these elements and their interrelationships, as well as discuss levels of measurement and the role of statistics in research.

    Concepts and Variables in Research

    Research begins with concepts – abstract ideas or phenomena that researchers aim to study. These concepts are often broad and require further refinement to be measurable in a scientific context[5]. For example, “educational achievement” is a concept that encompasses various aspects of a student’s performance and growth in an academic setting.

    To make these abstract concepts tangible and measurable, researchers operationalize them into variables. Variables are specific, measurable properties or characteristics of the concept under study. In the case of educational achievement, variables might include “performance at school” or “standardized test scores.”

    Types of Variables

    Research typically involves several types of variables:

    1. Independent Variables: These are the factors manipulated or controlled by the researcher to observe their effects on other variables. For instance, in a study on the impact of teaching methods on student performance, the teaching method would be the independent variable.
    2. Dependent Variables: These are the outcomes or effects that researchers aim to measure and understand. In the previous example, student performance would be the dependent variable, as it is expected to change in response to different teaching methods.
    3. Moderating Variables: These variables influence the strength or direction of the relationship between independent and dependent variables. For example, a student’s motivation level might moderate the effect of study time on exam performance.
    4. Mediating Variables: These variables help explain the mechanism through which an independent variable influences a dependent variable. For instance, increased focus might mediate the relationship between coffee consumption and exam performance.
    5. Control Variables: These are factors held constant to ensure they don’t impact the relationships being studied.

    Conceptual Models in Research

    A conceptual model is a visual representation of the relationships between variables in a study. It serves as a roadmap for the research, illustrating the hypothesized connections between independent, dependent, moderating, and mediating variables.

    Conceptual models are particularly useful in testing research or studies examining relationships between variables. They help researchers clarify their hypotheses and guide the design of their studies.

    Levels of Measurement

    When operationalizing concepts into variables, researchers must consider the level of measurement. There are four primary levels of measurement:

    1. Nominal: Categories without inherent order (e.g., gender, ethnicity).
    2. Ordinal: Categories with a meaningful order but no consistent interval between levels (e.g., education level).
    3. Interval: Numeric scales with consistent intervals but no true zero point (e.g., temperature in Celsius).
    4. Ratio: Numeric scales with consistent intervals and a true zero point (e.g., age, weight).

    Understanding the level of measurement is crucial as it determines the types of statistical analyses that can be appropriately applied to the data.

    The Goal and Function of Statistics in Research

    Statistics play a vital role in research, serving several key functions:

    1. Data Summary: Statistics provide methods to condense large datasets into meaningful summaries, allowing researchers to identify patterns and trends.
    2. Hypothesis Testing: Statistical tests enable researchers to determine whether observed effects are likely to be genuine or merely due to chance.
    3. Estimation: Statistics allow researchers to make inferences about populations based on sample data.
    4. Prediction: Statistical models can be used to forecast future outcomes based on current data.
    5. Relationship Exploration: Techniques like correlation and regression analysis help researchers understand the relationships between variables.

    The overarching goal of statistics in research is to provide a rigorous, quantitative framework for drawing conclusions from data. This framework helps ensure that research findings are reliable, reproducible, and generalizable.

  • Check List Survey

    Alignment with Research Objectives

    • Each question directly relates to at least one research objective
    • All research objectives are addressed by the questionnaire
    • No extraneous questions that don’t contribute to the research goals

    Question Relevance and Specificity

    • Questions are specific enough to gather precise data
    • Questions are relevant to the target population
    • Questions capture the intended constructs or variables

    Comprehensiveness

    • All key aspects of the research topic are covered
    • Sufficient depth is achieved in exploring complex topics
    • No critical areas of inquiry are omitted

    Logical Flow and Structure

    • Questions are organized in a logical sequence
    • Related questions are grouped together
    • The questionnaire progresses from general to specific topics (if applicable)

    Data Quality and Usability

    • Questions will yield data in the format needed for analysis
    • Response options are appropriate for the intended statistical analyses
    • Questions avoid double-barreled or compound issues

    Respondent Engagement

    • Questions are engaging and maintain respondent interest
    • Survey length is appropriate to avoid fatigue or dropout
    • Sensitive questions are appropriately placed and worded

    Clarity and Comprehension

    • Questions are easily understood by the target population
    • Technical terms or jargon are defined if necessary
    • Instructions are clear and unambiguous

    Bias Mitigation

    • Questions are neutrally worded to avoid leading respondents
    • Response options are balanced and unbiased
    • Social desirability bias is minimized in sensitive topics

    Measurement Precision

    • Scales used are appropriate for measuring the constructs
    • Sufficient response options are provided for nuanced data collection
    • Questions capture the required level of detail

    Validity Checks

    • Includes items to check for internal consistency (if applicable)
    • Contains control or validation questions to ensure data quality
    • Allows for cross-verification of key information

    Adaptability and Flexibility

    • Questions allow for unexpected or diverse responses
    • Open-ended questions are included where appropriate for rich data
    • Skip logic is properly implemented for relevant subgroups

    Actionability of Results

    • Data collected will lead to actionable insights
    • Questions address both current state and potential future states
    • Results will inform decision-making related to research goals

    Ethical Considerations

    • Questions respect respondent privacy and sensitivity
    • The questionnaire adheres to ethical guidelines in research
    • Consent and confidentiality are appropriately addressed
  • How to Create a Survey

    What is a great survey? 

    A great online survey provides you with clear, reliable, actionable insight to inform your decision-making. Great surveys have higher response rates, higher quality data and are easy to fill out. 

    Follow these 10 tips to create great surveys, improve the response rate of your survey, and improve the quality of the data you gather. 

    10 steps to create a great survey 

    1. Clearly define the purpose of your online survey 

    For BUAS we use Qualtrics which is a web–based online survey tool packed with industry–leading features designed by noted market researchers. 

    Fuzzy goals lead to fuzzy results, and the last thing you want to end up with is a set of results that provide no real decision–enhancing value. Good surveys have focused objectives that are easily understood. Spend time up front to identify, in writing: 

    • What is the goal of this survey? 
    • Why are you creating this survey? 
    • What do you hope to accomplish with this survey? 
    • How will you use the data you are collecting? 
    • What decisions do you hope to impact with the results of this survey? (This will later help you identify what data you need to collect in order to make these decisions.) 

    Sounds obvious, but we have seen plenty of surveys where a few minutes of planning could have made the difference between receiving quality responses (responses that are useful as inputs to decisions) or un–interpretable data. 

    Consider the case of the software firm that wanted to find out what new functionality was most important to customers. The survey asked ‘How can we improve our product?’ The resulting answers ranged from ‘Make it easier’ to ‘Add an update button on the recruiting page.’ While interesting information, this data is not really helpful for the product manager who wanted to make an itemized list for the development team, with customer input as a prioritization variable. 

    Spending time identifying the objective might have helped the survey creators determine: 

    • Are we trying to understand our customers’ perception of our software in order to identify areas of improvement (e.g. hard to use, time consuming, unreliable)? 
    • Are we trying to understand the value of specific enhancements? They would have been better off asking customers to please rank from 1 – 5 the importance of adding X new functionality. 

    Advance planning helps ensure that the survey asks the right questions to meet the objective and generate useful data. 

    2. Keep the survey short and focused 

    Short and focused helps with both quality and quantity of response. It is generally better to focus on a single objective than try to create a master survey that covers multiple objectives. 

    Shorter surveys generally have higher response rates and lower abandonment among survey respondents. It’s human nature to want things to be quick and easy – once a survey taker loses interest they simply abandon the task – leaving you to determine how to interpret that partial data set (or whether to use it all). 

    Make sure each of your questions is focused on helping to meet your stated objective. Don’t toss in ‘nice to have’ questions that don’t directly provide data to help you meet your objectives. 

    To be certain that the survey is short; time a few people taking the survey. SurveyMonkey research (along with Gallup and others) has shown that the survey should take 5 minutes or less to complete. 6 – 10 minutes is acceptable but we see significant abandonment rates occurring after 11 minutes. 

    3. Keep the questions simple 

    Make sure your questions get to the point and avoid the use of jargon. We on the SurveyMonkey team have often received surveys with questions along the lines of: “When was the last time you used our RGS?” (What’s RGS?) Don’t assume that your survey takers are as comfortable with your acronyms as you are. 

    Try to make your questions as specific and direct as possible. Compare: What has your experience been working with our HR team? To: How satisfied are you with the response time of our HR team? 

    4. Use closed ended questions whenever possible 

    Closed ended survey questions give respondents specific choices (e.g. Yes or No), making it easier to analyze results. Closed ended questions can take the form of yes/no, multiple choice or rating scale. Open ended survey questions allow people to answer a question in their own words. Open–ended questions are great supplemental questions and may provide useful qualitative information and insights. However, for collating and analysis purposes, closed ended questions are preferable. 

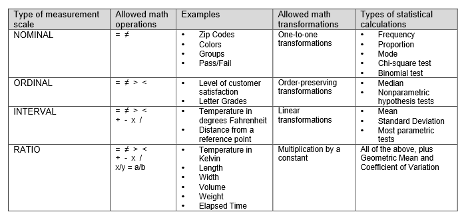
    5. Keep rating scale questions consistent through the survey 

    Rating scales are a great way to measure and compare sets of variables. If you elect to use rating scales (e.g. from 1 – 5) keep it consistent throughout the survey. Use the same number of points on the scale and make sure meanings of high and low stay consistent throughout the survey. Also, use an odd number in your rating scale to make data analysis easier. Switching your rating scales around will confuse survey takers, which will lead to untrustworthy responses. 

    6. Logical ordering 

    Make sure your survey flows in a logical order. Begin with a brief introduction that motivates survey takers to complete the survey (e.g. “Help us improve our service to you. Please answer the following short survey.”). Next, it is a good idea to start from broader–based questions and then move to those narrower in scope. It is usually better to collect demographic data and ask any sensitive questions at the end (unless you are using this information to screen out survey participants). If you are asking for contact information, place that information last. 

    7. Pre–test your survey 

    Make sure you pre–test your survey with a few members of your target audience and/or co–workers to find glitches and unexpected question interpretations. 

    8. Consider your audience when sending survey invitations 

    Recent statistics show the highest open and click rates take place on Monday, Friday and Sunday. In addition, our research shows that the quality of survey responses does not vary from weekday to weekend. That being said, it is most important to consider your audience. For instance, for employee surveys, you should send during the business week and at a time that is suitable for your business. i.e. if you are a sales driven business avoid sending to employees at month end when they are trying to close business. 

    9. Consider sending several reminders 

    While not appropriate for all surveys, sending out reminders to those who haven’t previously responded can often provide a significant boost in response rates. 

    10. Consider offering an incentive 

    Depending upon the type of survey and survey audience, offering an incentive is usually very effective at improving response rates. People like the idea of getting something for their time. SurveyMonkey research has shown that incentives typically boost response rates by 50% on average. 

    One caveat is to keep the incentive appropriate in scope. Overly large incentives can lead to undesirable behavior, for example, people lying about demographics in order to not be screened out from the survey. 

  • Univariate Analysis: Understanding Measures of Central Tendency and Dispersion

    Univariate analysis is a statistical method that focuses on analyzing one variable at a time. In this type of analysis, we try to understand the characteristics of a single variable by using various statistical techniques. The main objective of univariate analysis is to get a comprehensive understanding of a single variable, its distribution, and its relationship with other variables. 

    Measures of Central Tendency 

     Measures of central tendency are statistical measures that help us to determine the center of a dataset. They give us an idea of where most of the data lies and what is the average value of a dataset. There are three main measures of central tendency: mean, median, and mode. 

    1. Mean The mean, also known as the average, is calculated by adding up all the values of a dataset and then dividing the sum by the total number of values. It is represented by the symbol ‘μ’ (mu) in statistics. The mean is the most commonly used measure of central tendency. 
    1. Median The median is the middle value of a dataset when the data is arranged in ascending or descending order. If the number of values in a dataset is odd, the median is the middle value. If the number of values is even, the median is the average of the two middle values. 
    1. Mode The mode is the value that appears most frequently in a dataset. It is the most common value in a dataset. A dataset can have one mode, multiple modes, or no mode. 

    Measures of Dispersion 

    Measures of dispersion are statistical measures that help us to determine the spread of a dataset. They give us an idea of how far the values in a dataset are spread out from the central tendency. There are two main measures of dispersion: range and standard deviation. 

    1. Range The range is the difference between the largest and smallest values in a dataset. It gives us an idea of how much the values in a dataset vary. 
    1. Standard Deviation The standard deviation is a measure of how much the values in a dataset vary from the mean. It is represented by the symbol ‘σ’ (sigma) in statistics. The standard deviation is a more precise measure of dispersion than the range. 

    Conclusion 

    In conclusion, univariate analysis is a statistical method that helps us to understand the characteristics of a single variable. Measures of central tendency and measures of dispersion are two important concepts in univariate analysis that help us to determine the center and spread of a dataset. Understanding these concepts is crucial for analyzing data and making informed decisions. 

  • Methods of Conducting Quantitative Research

    Quantitative research is a type of research that uses numerical data and statistical analysis to understand and explain phenomena. It is a systematic and objective method of collecting, analyzing, and interpreting data to answer research questions and test hypotheses.

    conduct

    The following are some of the commonly used methods for conducting quantitative research:

    1. Survey research: This method involves collecting data from a large number of individuals through self-administered questionnaires or interviews. Surveys can be administered in person, by mail, by phone, or online.
    2. Experimental research: In experimental research, the researcher manipulates an independent variable to observe the effect on a dependent variable. The goal is to establish cause-and-effect relationships between variables.
    3. Quasi-experimental research: This method is similar to experimental research, but the researcher does not have full control over the assignment of participants to groups.
    4. Correlational research: This method involves examining the relationship between two or more variables without manipulating any of them. The goal is to identify patterns of association between variables.
    5. Longitudinal research: This method involves collecting data from the same individuals over an extended period of time. The goal is to study changes in variables over time and understand the underlying processes.
    6. Cross-sectional research: This method involves collecting data from different individuals at the same point in time. The goal is to study differences between groups and understand the prevalence of variables in a population.
    7. Case study research: This method involves in-depth examination of a single individual or group. The goal is to gain a comprehensive understanding of a phenomenon.

    It is important to choose the appropriate method based on the research question and the type of data being analyzed. For example, if the goal is to establish cause-and-effect relationships, an experimental design is more appropriate than a survey design.

    Quantitative research is a valuable tool for understanding and explaining phenomena in a systematic and objective way. By selecting the appropriate method, researchers can collect and analyze data to answer their research questions and test hypotheses.

  • Developing a Hypothesis

    A hypothesis is a statement that predicts the relationship between two or more variables. It is a crucial step in the scientific process, as it sets the direction for further investigation and helps researchers to determine whether their assumptions and predictions are supported by evidence. In this blog post, we will discuss the steps involved in developing a hypothesis and provide tips for making your hypothesis as effective as possible.

    Step 1: Identify a Research Problem

    The first step in developing a hypothesis is to identify a research problem. This can be done by reviewing the literature in your field, consulting with experts, or simply observing a phenomenon that you find interesting. Once you have identified a problem, you should clearly define the question you want to answer and determine the variables that may be relevant to the problem.

    Step 2: Conduct a Literature Review

    Once you have defined your research problem, the next step is to conduct a literature review. This will help you to understand what is already known about the topic, identify gaps in the literature, and determine what has been done and what still needs to be done. During this step, you should also identify any potential biases, limitations, or gaps in the existing research, as this will help you to refine your hypothesis and avoid making the same mistakes as previous researchers.

    Step 3: Formulate a Hypothesis

    With a clear understanding of the research problem and existing literature, you can now formulate a hypothesis. A well-written hypothesis should be clear, concise, and specific, and should specify the variables that you expect to be related. For example, if you are studying the relationship between exercise and weight loss, your hypothesis might be: “Regular exercise will lead to significant weight loss.”

    • The null hypothesis and the alternative hypothesis are two types of hypotheses that are used in statistical testing.

    The null hypothesis (H0) is a statement that predicts that there is no significant relationship between the variables being studied. In other words, the null hypothesis assumes that any observed relationship between the variables is due to chance or random error. The null hypothesis is the default position and is assumed to be true unless evidence is found to reject it.

    • The alternative hypothesis (H1), on the other hand, is a statement that predicts that there is a significant relationship between the variables being studied. The alternative hypothesis is what the researcher is trying to prove, and is the opposite of the null hypothesis. In statistical testing, the goal is to determine whether there is sufficient evidence to reject the null hypothesis in favor of the alternative hypothesis.

    When conducting statistical tests, researchers typically set a significance level, which is the probability of rejecting the null hypothesis when it is actually true. The most commonly used significance level is 0.05, which means that there is a 5% chance of rejecting the null hypothesis when it is actually true.

    It is important to note that the null hypothesis and alternative hypothesis should be complementary and exhaustive, meaning that they should cover all possible outcomes of the study and that only one of the hypotheses can be true. The results of the statistical test will either support the null hypothesis or provide evidence to reject it in favor of the alternative hypothesis.

    Step 4: Refine and Test Your Hypothesis

    Once you have formulated a hypothesis, you should refine it based on your literature review and any additional information you have gathered. This may involve making changes to the variables you are studying, adjusting the methods you will use to test your hypothesis, or modifying your hypothesis to better reflect your research question.

    Once your hypothesis is refined, you can then test it using a variety of methods, such as surveys, experiments, or observational studies. The results of your study should provide evidence to support or reject your hypothesis, and will inform the next steps in your research process.

    Tips for Developing Effective Hypotheses:

    1. Be Specific: Your hypothesis should clearly state the relationship between the variables you are studying, and should avoid using vague or imprecise language.
    2. Be Realistic: Your hypothesis should be based on existing knowledge and should be feasible to test.
    3. Avoid Confirmation Bias: Be open to the possibility that your hypothesis may be wrong, and avoid assuming that your results will support your hypothesis before you have collected and analyzed the data.
    4. Consider Alternative Hypotheses: Be sure to consider alternative explanations for the relationship between the variables you are studying, and be prepared to revise your hypothesis if your results suggest a different relationship.

    Developing a hypothesis is a critical step in the scientific process and is essential for conducting rigorous and reliable research. By following the steps outlined above, and by keeping these tips in mind, you can develop an effective and well-supported hypothesis that will guide your research and lead to new insights and discoveries

  • Links to AI tools

    Elicit

    Elicit

    Purpose and Functionality

    Literature Search: Quickly locates papers on a given research topic, even without perfect keyword matching.

    • Paper Analysis: Summarizes key information from papers, including abstracts, interventions, outcomes, and more.
    • Research Question Exploration: Helps brainstorm and refine research questions.
    • Search Term Suggestions: Provides synonyms and related terms to improve searches.
    • Data Extraction: Can extract specific data points from uploaded PDFs.

    Litmaps

    litmaps

    Visual Literature Mapping

    • Creates dynamic visual networks of academic papers
    • Shows interconnections between research articles
    • Helps researchers understand the scientific landscape of a topic

    Search and Discovery

    • Allows users to start with a seed article and explore related research
    • Provides recommendations based on citations, references, and interconnectedness
    • Uses advanced algorithms to find relevant papers beyond direct citations

    Paper Digest

    Paper Digest

    Paper Digest is an AI-powered scholarly assistant designed to help researchers, students, and professionals navigate and analyze academic research more efficiently. Here are its key features and functions:

    Main Functions

    Research Paper Search and Summarization

    • Quickly find and summarize relevant academic papers
    • Provide detailed insights and key findings from scientific literature.
    • Assist in identifying the most recent and high-impact research in a specific field

    Unique Features

    • No Hallucinations Guarantee: Ensures summaries are based on verifiable sources without fabricated information
    • Up-to-Date Data Integration: Continuously updates from hundreds of authoritative sources in real-time
    • Customizable search parameters allowing users to define research scope

    Notebook LM

    notbooklm

    NotebookLM is an experimental AI-powered research assistant developed by Google. Here are the key features and capabilities of NotebookLM:

    NotebookLM allows users to consolidate and analyze information from multiple sources, acting as a virtual research assistant. Its main functions include:

    • Summarizing uploaded documents
    • Answering questions about the content
    • Generating insights and new ideas based on the source material
    • Creating study aids like quizzes, FAQs, and outlines

    NotebookLM is particularly useful for:

    • Students and researchers synthesizing information from multiple sources
    • Content creators organizing ideas and generating scripts
    • Professionals preparing presentations or reports
    • Anyone looking to gain insights from complex or lengthy documents.

    Storm

    storm

    STORM (Synthesis of Topic Outlines through Retrieval and Multi-perspective Question Asking) is an innovative AI-powered research and writing tool developed by Stanford University. Launched in early 2024, STORM is designed to create comprehensive, Wikipedia-style articles on any given topic within minutes.

    Key features of STORM include:

    1. Automated content creation: STORM generates detailed, well-structured articles on a wide range of topics by leveraging large language models (LLMs) and simulating conversations between writers and topic experts.
    2. Source referencing: Each piece of information is linked back to its original source, allowing for easy fact-checking and further exploration.
    3. Multi-agent research: STORM utilizes a team of AI agents to conduct thorough research on the given topic, including research agents, question-asking agents, expert agents, and synthesis agents.
    4. Open-source availability: As an open-source project, STORM is accessible to developers and researchers worldwide, fostering collaboration and continuous improvement.
    5. Top-down writing approach: STORM employs a top-down approach, establishing the outline before writing content, which is crucial for effectively conveying information to readers.

    STORM is particularly useful for academics, students, and content creators looking to craft well-researched articles quickly. It can serve as a valuable tool for finding research resources, conducting background research, and generating comprehensive overviews of various topics.

    Chat GPT

    Chatgpt

    ChatGPT is an advanced artificial intelligence (AI) chatbot developed by OpenAI, designed to facilitate human-like conversations through natural language processing (NLP). Launched in November 2022, it utilizes a generative AI model called Generative Pre-trained Transformer (GPT), specifically the latest versions being GPT-4o and its mini variant. This technology enables ChatGPT to understand and generate text that closely resembles human conversation, allowing it to respond to inquiries, compose written content, and perform various tasks across different domains[1][2][5].

    Applications of ChatGPT

    The applications of ChatGPT are extensive:

    • Content Creation: Users leverage it to draft articles, blog posts, and marketing materials.
    • Educational Support: ChatGPT aids in answering questions and explaining complex topics in simpler terms.
    • Creative Writing: It generates poetry, scripts, and even music compositions.
    • Personal Assistance: Users can create lists for tasks or plan events with its help.

    Limitations

    Despite its capabilities, ChatGPT has limitations:

    • It may produce incorrect or misleading information.
    • Its knowledge base is capped at data available up until 2021 for some versions, limiting its awareness of recent events[4].
    • There are concerns regarding the potential for generating biased or harmful content.

    Perplexity

    Perplexity

    Perplexity AI is an innovative conversational search engine designed to provide users with accurate and real-time answers to their queries. Launched in 2022 and based in San Francisco, California, it leverages advanced large language models (LLMs) to synthesize information from various sources on the internet, presenting it in a concise and user-friendly format.

    use cases

    Perplexity AI serves various purposes, such as:

    • Research and Information Gathering: It helps users conduct thorough research on diverse topics by allowing follow-up questions for deeper insights.
    • Content Creation: Users can utilize Perplexity for writing assistance, including summarizing articles or generating SEO content.
    • Project Management: The platform allows users to organize their queries into collections, making it suitable for managing research projects.
    • Fact-Checking: With its citation capabilities, Perplexity is useful for verifying facts and sources.

    Consensus

    Consensus AI is an AI-powered academic search engine designed to streamline research processes.

    Key Features

    • Extensive Coverage: Access to over 200 million peer-reviewed papers across various scientific domains.
    • Trusted Results: Provides scientifically verified answers with citations from credible sources.
    • Advanced Search Capabilities: Utilizes language models and vector search for precise relevance measurement.
    • Quick Analysis: Offers instant summaries and analysis, saving time for researchers.
    • Consensus Meter: Displays agreement levels (Yes, No, Possibly) on research questions.

    Benefits

    • Efficiency: Simplifies literature reviews and decision-making by quickly extracting key insights.
    • User-Friendly: Supports intuitive searching with natural language processing.

    Consensus AI is ideal for researchers needing accurate, evidence-based insights efficiently.

    Napkin.AI

    Napkin.AI is an innovative AI-driven tool designed to help users capture, organize, and visualize their ideas in a flexible and creative manner. Here are its key features and benefits:

    Key Features

    • Idea Capturing and Organizing: Users can quickly jot down ideas as text or sketches, organizing them into clusters or timelines for better structure and understanding.
    • AI-Powered Insights: The platform utilizes AI to analyze notes and suggest connections, helping users discover relationships between ideas that may not be immediately apparent.
    • Visual Mapping: Napkin.AI allows the creation of mind maps and visual diagrams, making it easier to understand complex topics and relationships visually.
    • Text-to-Visual Conversion: Automatically transforms written content into engaging graphics, diagrams, and infographics, enhancing communication and storytelling.

    Benefits

    • Flexible Workspace: The freeform nature of Napkin.AI allows for nonlinear thinking, making it ideal for creatives who prefer an open-ended approach to idea management.
    • Enhanced Creativity: AI-driven suggestions for linking ideas save time and inspire creativity by surfacing related concepts.
    • User-Friendly Interface: The clean design makes it easy for users of all skill levels to navigate the platform without a steep learning curve.

    Napkin.AI combines these features to provide a powerful platform for individuals and teams looking to enhance their brainstorming sessions and project planning through visual thinking.

    AnswerThis.io

    advanced AI-powered research tool designed to enhance the academic research experience. It offers a variety of features aimed at streamlining literature reviews and data analysis, making it a valuable resource for researchers, scholars, and students. Here are the key features and benefits:

    Key Features

    Comprehensive Literature Reviews

    AnswerThis generates in-depth literature reviews by analyzing over 200 million research papers and reliable internet sources. This capability allows users to obtain relevant and up-to-date information tailored to their specific questions.

    Source Summaries

    The platform provides summaries of up to 20 sources for each literature review, including:

    • A comprehensive summary of each source.
    • Access to PDFs of the original papers when available.

    Flexible Search Options

    Users can perform searches with various filters such as:

    • Source type (research papers, internet sources, or personal library).
    • Time frame.
    • Field of study.
    • Minimum number of citations required.

    Citation Management

    The platform supports direct citations and allows users to export citations in multiple formats (e.g., APA, MLA, Chicago) for easy integration into their work).

    Benefits

    1. Time Efficiency

    By automating the literature review process and summarizing complex papers, AnswerThis significantly saves time for researchers who would otherwise spend hours sifting through numerous sources.

    2. Access to Credible Sources

    The tool provides users with access to a wide range of credible academic sources, enhancing the quality and reliability of their research.

    3. Enhanced Understanding

    AnswerThis helps users understand intricate academic content through clear summaries and structured information, making it easier to grasp complex concepts.

    TurboScribe

    offers several impressive features and benefits. Here are three key highlights:

    1. Unlimited Transcriptions: TurboScribe allows users to transcribe an unlimited number of audio and video files, making it ideal for heavy usage without incurring additional costs12. This feature is particularly beneficial for professionals handling high-volume projects or individuals with frequent transcription needs.
    2. High Accuracy and Speed: The tool boasts a remarkable 99.8% accuracy rate, powered by advanced AI technology23. It can convert files to text in seconds, significantly reducing the time spent on manual transcription and minimizing the need for extensive corrections34.
    3. Multi-Language Support: TurboScribe supports transcription in over 98 languages and offers translation capabilities for more than 130 languages13. This extensive language support makes it an invaluable tool for global users, enabling efficient communication across language barriers and expanding its utility for international businesses, researchers, and content creators.

    Gamma.ai

    AI-powered content creation tool that offers several key functions and advantages:

    1. AI-Driven Content Generation: Users can create presentations, documents, and websites quickly by entering text prompts or selecting templates[1][3]. The AI analyzes input and generates visually appealing, professional-quality content tailored to specific needs[3].
    2. One-Click Polish and Restyle: Gamma.ai can refine rough drafts into polished presentations with a single click, handling formatting, styling, and aesthetics automatically[2].
    3. Flexible Cards: The platform uses adaptable cards to condense complex topics while maintaining detail and context[2].
    4. Real-Time Collaboration: Multiple users can work on a single project simultaneously, fostering team synergy and improving productivity[1].
    5. Analytics Tools: Gamma.ai provides insights on audience engagement, helping users refine their presentations for better viewer resonance[1].
    6. Unlimited Presentations: Users can create as many presentations as needed without restrictions, promoting creativity and productivity[1].
    7. Integration Capabilities: The platform integrates with over 294 systems, improving workflow efficiency[1].
    8. Data Visualization: Gamma.ai offers tools to help users effectively visualize data in their presentations[1].
    9. Export Options: The platform allows for easy export of unlimited PDF and PPT files[5].