Tag: Research Methods

  • Related t-test (Chapter13)

    Introduction

    The related t-test, also known as the paired or dependent samples t-test, is a statistical method extensively discussed in Chapter 13 of “Introduction to Statistics in Psychology” by Howitt and Cramer. This test is particularly relevant for media students as it provides a robust framework for analyzing data collected from repeated measures or matched samples, which are common in media research (Howitt & Cramer, 2020).

    Understanding the Basics of the Related T-Test

    The related t-test is designed to compare two sets of scores from the same group of participants under different conditions or at different times. This makes it ideal for media research scenarios such as:

    • Assessing Change Over Time: Media researchers can use this test to evaluate changes in audience perceptions or behaviors after exposure to specific media content. For example, examining how a series of advertisements affects viewers’ attitudes toward a brand.
    • Evaluating Media Interventions: This test can assess the effectiveness of interventions like media literacy programs by comparing pre- and post-intervention scores on knowledge or behavior metrics.
    • Comparing Responses to Different Stimuli: It allows researchers to compare emotional responses to different types of media content, such as contrasting reactions to violent versus non-violent films (Howitt & Cramer, 2020).

    When to Use the Related T-Test

    The related t-test is suitable when the scores from two conditions are correlated. Common scenarios include:

    • Repeated Measures Designs: The same participants are measured under both conditions, such as before and after viewing a documentary.
    • Matched Samples: Participants are paired based on characteristics like age or media consumption habits, ensuring that comparisons are made between similar groups (Howitt & Cramer, 2020).

    The Logic Behind the Related T-Test

    The test examines whether the mean difference between two sets of scores is statistically significant. The steps involved include:

    1. Calculate Difference Scores: Determine the difference between scores for each participant across conditions.
    2. Calculate Mean Difference: Compute the average of these difference scores.
    3. Calculate Standard Error: Assess the variability of the mean difference.
    4. Calculate T-Score: Determine how many standard errors the sample mean difference deviates from zero.
    5. Assess Statistical Significance: Compare the t-score against a critical value from the t-distribution table to determine significance (Howitt & Cramer, 2020).

    Interpreting Results

    When interpreting results:

    • Examine Mean Scores: Identify which condition has a higher mean score to understand the direction of effects.
    • Assess Significance Level: A p-value less than 0.05 generally indicates statistical significance.
    • Consider Effect Size: Even significant differences should be evaluated for practical significance using measures like Cohen’s d (Howitt & Cramer, 2020).

    Reporting Results

    According to APA guidelines, results should be reported concisely and informatively:

    Example: “Eye contact was slightly higher at nine months (M = 6.75) than at six months (M = 5.25). However, this did not support a significant difference hypothesis, t(7) = -1.98, p > 0.05” (Howitt & Cramer, 2020).

    Key Assumptions and Cautions

    The related t-test assumes that:

    • The distribution of difference scores is not skewed significantly.
    • Multiple comparisons require adjusted significance levels to avoid Type I errors (Howitt & Cramer, 2020).

    SPSS and Real-World Applications

    SPSS software can facilitate conducting related t-tests by simplifying data analysis processes. Real-world examples in media research demonstrate its application in evaluating media effects and audience responses (Howitt & Cramer, 2020).

    References

    Howitt, D., & Cramer, D. (2020). Introduction to statistics in psychology (6th ed.). Pearson Education Limited.

    (Note: The reference list should be formatted according to APA style guidelines.)

    Citations:
    [1] https://www.student.unsw.edu.au/citing-broadcast-materials-apa-referencing
    [2] https://apastyle.apa.org/style-grammar-guidelines/references/examples
    [3] https://guides.himmelfarb.gwu.edu/APA/av
    [4] https://camosun.libguides.com/apa7/media
    [5] https://libguides.tru.ca/apa/audiovisual
    [6] https://guides.lib.ua.edu/APA7/media
    [7] https://www.lib.sfu.ca/help/cite-write/citation-style-guides/apa/websites
    [8] https://libguides.uww.edu/apa/multimedia

  • Correlation (Chapter 8)

    Understanding Correlation in Media Research: A Look at Chapter 8

    Correlation analysis is a fundamental statistical tool in media research, allowing researchers to explore relationships between variables and draw meaningful insights. Chapter 8 of “Introduction to Statistics in Psychology” by Howitt and Cramer (2020) provides valuable information on correlation, which can be applied to media studies. This essay will explore key concepts from the chapter, adapting them to the context of media research and highlighting their relevance for first-year media students.

    The Power of Correlation Coefficients

    While scattergrams offer visual representations of relationships between variables, correlation coefficients provide a more precise quantification. As Howitt and Cramer (2020) explain, a correlation coefficient summarizes the key features of a scattergram in a single numerical index, indicating both the direction and strength of the relationship between two variables.

    The Pearson Correlation Coefficient

    The Pearson correlation coefficient, denoted as “r,” is the most commonly used measure of correlation in media research. It ranges from -1 to +1, with -1 indicating a perfect negative correlation, +1 a perfect positive correlation, and 0 signifying no correlation (Howitt & Cramer, 2020). Values between these extremes represent varying degrees of correlation strength.

    Interpreting Correlation Coefficients in Media Research

    For media students, the ability to interpret correlation coefficients is crucial. Consider the following example:

    A study examining the relationship between social media usage and academic performance among college students found a moderate negative correlation (r = -0.45, p < 0.01)[1]. This suggests that as social media usage increases, academic performance tends to decrease, though the relationship is not perfect.

    It’s important to note that correlation does not imply causation. As Howitt and Cramer (2020) emphasize, even strong correlations do not necessarily indicate a causal relationship between variables.

    The Coefficient of Determination

    Chapter 8 introduces the coefficient of determination (r²), which represents the proportion of shared variance between two variables. In media research, this concept is particularly useful for understanding the predictive power of one variable over another.

    For instance, in the previous example, r² would be 0.2025, indicating that approximately 20.25% of the variance in academic performance can be explained by social media usage[1].

    Statistical Significance in Correlation Analysis

    Howitt and Cramer (2020) briefly touch on significance testing, which is crucial for determining whether an observed correlation reflects a genuine relationship in the population or is likely due to chance. In media research, reporting p-values alongside correlation coefficients is standard practice.

    Spearman’s Rho: An Alternative to Pearson’s r

    For ordinal data, which is common in media research (e.g., rating scales for media content), Spearman’s rho is an appropriate alternative to Pearson’s r. Howitt and Cramer (2020) explain that this coefficient is used when data are ranked rather than measured on a continuous scale.

    Correlation in Media Research: Real-World Applications

    Recent studies have demonstrated the practical applications of correlation analysis in media research. For example, a study on social media usage and reading ability among English department students found a high positive correlation (r = 0.622) between these variables[2]. This suggests that increased social media usage is associated with improved reading ability, though causal relationships cannot be inferred.

    SPSS: A Valuable Tool for Correlation Analysis

    As Howitt and Cramer (2020) note, SPSS is a powerful statistical software package that simplifies complex analyses, including correlation. Familiarity with SPSS can be a significant asset for media students conducting research.

    References:

    Howitt, D., & Cramer, D. (2020). Introduction to Statistics in Psychology (7th ed.). Pearson.

    [1] Editage Insights. (2024, September 9). Demystifying Pearson’s r: A handy guide. https://www.editage.com/insights/demystifying-pearsons-r-a-handy-guide

    [2] IDEAS. (2022). The Correlation between Social Media Usage and Reading Ability of the English Department Students at University of Riau. IDEAS, 10(2), 2207. https://ejournal.iainpalopo.ac.id/index.php/ideas/article/download/3228/2094/11989

  • Relationships Between more than one variable (Chapter 7)

    Exploring Relationships Between Multiple Variables: A Guide for Media Students

    In the dynamic world of media studies, understanding the relationships between multiple variables is crucial for analyzing audience behavior, content effectiveness, and media trends. This essay will explore various methods for visualizing and analyzing these relationships, adapting concepts from statistical analysis to the media context.

    The Importance of Multivariate Analysis in Media Studies

    Media phenomena are often complex, involving interactions between numerous variables such as audience demographics, content types, platform preferences, and engagement metrics. As Gunter (2000) emphasizes in his book “Media Research Methods,” examining relationships between variables allows media researchers to test hypotheses and develop a deeper understanding of media consumption patterns and effects.

    Types of Variables in Media Research

    In media studies, we often encounter two main types of variables:

    1. Categorical data (e.g., gender, media platform, content genre)
    2. Numerical data (e.g., viewing time, engagement rate, subscriber count)

    Based on these classifications, we can identify three types of relationships commonly explored in media research:

    • Type A: Both variables are numerical (e.g., viewing time vs. engagement rate)
    • Type B: Both variables are categorical (e.g., preferred platform vs. content genre)
    • Type C: One variable is categorical, and the other is numerical (e.g., age group vs. daily social media usage)

    Visualizing Type A Relationships: Scatterplots

    For Type A relationships, scatterplots are highly effective. As Webster and Phalen (2006) discuss in their book “The Mass Audience,” scatterplots can reveal patterns such as positive correlations (e.g., increased ad spend leading to higher viewer numbers), negative correlations (e.g., longer video length resulting in decreased completion rates), or lack of correlation.

    Recent advancements in data visualization have expanded the use of scatterplots in media research. For instance, interactive scatterplots can now incorporate additional dimensions, such as using color to represent a third variable (e.g., content genre) or size to represent a fourth (e.g., budget size).

    Visualizing Type B Relationships: Contingency Tables and Heatmaps

    For Type B relationships, contingency tables are valuable tools. These tables show the frequencies of cases falling into each possible combination of categories. In media research, this could be used to explore, for example, the relationship between preferred social media platform and age group.

    Building on this, Hasebrink and Popp (2006) introduced the concept of media repertoires, which can be effectively visualized using heatmaps. These color-coded tables can display the intensity of media use across different platforms and genres, providing a rich visualization of categorical relationships.

    Visualizing Type C Relationships: Bar Charts and Box Plots

    For Type C relationships, bar charts and box plots are particularly useful. Bar charts can effectively display, for example, average daily social media usage across different age groups. Box plots, as described by Tukey (1977), can provide a more detailed view of the distribution, showing median, quartiles, and potential outliers.

    Advanced Techniques for Multivariate Visualization in Media Studies

    As media datasets become more complex, advanced visualization techniques are increasingly valuable. Network graphs, for instance, can visualize relationships between multiple media entities, as demonstrated by Ksiazek (2011) in his analysis of online news consumption patterns.

    Another powerful technique is the use of treemaps, which can effectively visualize hierarchical data. For example, a treemap could display market share of streaming platforms, with each platform further divided into content genres.

    References

    Gunter, B. (2000). Media research methods: Measuring audiences, reactions and impact. Sage.

    Hasebrink, U., & Popp, J. (2006). Media repertoires as a result of selective media use. A conceptual approach to the analysis of patterns of exposure. Communications, 31(3), 369-387.

    Ksiazek, T. B. (2011). A network analytic approach to understanding cross-platform audience behavior. Journal of Media Economics, 24(4), 237-251.

    Tukey, J. W. (1977). Exploratory data analysis. Addison-Wesley.

    Webster, J. G., & Phalen, P. F. (2006). The mass audience: Rediscovering the dominant model. Routledge.

  • Data Collection (Part C)

    Research Methods in Social Research: A Comprehensive Guide to Data Collection

    Part C of “Research Methods: A Practical Guide for the Social Sciences” by Matthews and Ross focuses on the critical aspect of data collection in social research. This section provides a comprehensive overview of various data collection methods, their applications, and practical considerations for researchers.

    The authors emphasize that data collection is a practical activity, building upon the concept of data as a representation of social reality (Matthews & Ross, 2010). They introduce three key continua to help researchers select appropriate tools for their studies:

    1. Structured/Semi-structured/Unstructured Data
    2. Present/Absent Researcher
    3. Active/Passive Researcher

    These continua highlight the complexity of choosing data collection methods, emphasizing that it’s not a simple binary decision but rather a nuanced process considering multiple factors[1].

    The text outlines essential data collection skills, including record-keeping, format creation, note-taking, communication skills, and technical proficiency. These skills are crucial for ensuring the quality and reliability of collected data[1].

    Chapters C3 through C10 explore specific data collection methods in detail:

    1. Questionnaires: Widely used for collecting structured data from large samples[1].
    2. Semi-structured Interviews: Offer flexibility for gathering in-depth data[1].
    3. Focus Groups: Leverage group dynamics to explore attitudes and opinions[1].
    4. Observation: Involves directly recording behaviors in natural settings[1].
    5. Narrative Data: Focuses on collecting and analyzing personal stories[1].
    6. Documents: Valuable sources for insights into past events and social norms[1].
    7. Secondary Sources of Data: Utilizes existing datasets and statistics[1].
    8. Computer-Mediated Communication (CMC): Explores new avenues for data collection in the digital age[1].

    Each method is presented with its advantages, disadvantages, and practical considerations, providing researchers with a comprehensive toolkit for data collection.

    The choice of research method in social research depends on various factors, including the research question, the nature of the data required, and the resources available. As Bryman (2016) notes in “Social Research Methods,” the selection of a research method should be guided by the research problem and the specific aims of the study[2].

    Creswell and Creswell (2018) in “Research Design: Qualitative, Quantitative, and Mixed Methods Approaches” emphasize the importance of aligning the research method with the philosophical worldview of the researcher and the nature of the inquiry[3]. They argue that the choice between qualitative, quantitative, or mixed methods approaches should be informed by the research problem and the researcher’s personal experiences and worldviews.

    Part C of Matthews and Ross’s “Research Methods: A Practical Guide for the Social Sciences” provides a comprehensive foundation for understanding and implementing various data collection methods in social research. By considering the three key continua and exploring the range of available methods, researchers can make informed decisions about the most appropriate approaches for their specific research questions and contexts.

    References:

    Matthews, B., & Ross, L. (2010). Research methods: A practical guide for the social sciences. Pearson Education.

    Bryman, A. (2016). Social research methods. Oxford University Press.

    Creswell, J. W., & Creswell, J. D. (2018). Research design: Qualitative, quantitative, and mixed methods approaches. Sage publications.

    Citations:
    [1] https://www.bol.com/nl/nl/f/research-methods/39340982/
    [2] https://search.worldcat.org/title/Research-methods-:-a-practical-guide-for-the-social-sciences/oclc/867911596
    [3] https://www.pearson.com/en-gb/subject-catalog/p/research-methods-a-practical-guide-for-the-social-sciences/P200000004950/9781408226186
    [4] https://search.worldcat.org/title/Research-methods-:-a-practical-guide-for-the-social-sciences/oclc/780979587
    [5] https://www.studeersnel.nl/nl/document/tilburg-university/methodologie-4-ects/summary-research-methods-bob-matthews-liz-ross/109770
    [6] https://books.google.com/books/about/Research_Methods.html?id=g2mpBwAAQBAJ
    [7] https://books.google.com/books/about/Research_Methods.html?id=7s4ERAAACAAJ
    [8] https://academic.oup.com/bjc/article-abstract/52/5/1017/470134?login=false&redirectedFrom=fulltext

  • Choosing Method(Chapter B4)

    The choice of research method in social research is a critical decision that shapes the entire research process. Matthews and Ross (2010) emphasize the importance of aligning research methods with research questions and objectives. This alignment ensures that the chosen methods effectively address the research problem and yield meaningful results.

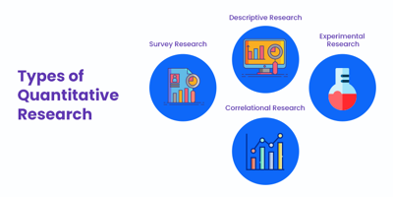
    Quantitative and qualitative research methods represent two distinct approaches to social inquiry. Quantitative research deals with numerical data and statistical analysis, aiming to test hypotheses and establish generalizable patterns[1]. It employs methods such as surveys, experiments, and statistical analysis of existing data[3]. Qualitative research, on the other hand, focuses on non-numerical data like words, images, and sounds to explore subjective experiences and attitudes[3]. It utilizes techniques such as interviews, focus groups, and observations to gain in-depth insights into social phenomena[1].

    The debate between quantitative and qualitative approaches has evolved into a recognition of their complementary nature. Mixed methods research, which combines both approaches, has gained prominence in social sciences. This approach allows researchers to leverage the strengths of both methodologies, providing a more comprehensive understanding of complex social issues[4]. For instance, a study might use surveys to gather quantitative data on trends, followed by in-depth interviews to explore the underlying reasons for these trends.

    When choosing research methods, several practical considerations come into play. Researchers must consider the type of data required, their skills and resources, and the specific research context[4]. The nature of the research question often guides the choice of method. For example, if the goal is to test a hypothesis or measure the prevalence of a phenomenon, quantitative methods may be more appropriate. Conversely, if the aim is to explore complex social processes or understand individual experiences, qualitative methods might be more suitable[2].

    It’s important to note that the choice of research method is not merely a technical decision but also reflects epistemological and ontological assumptions about the nature of social reality and how it can be studied[1]. Researchers should be aware of these philosophical underpinnings when selecting their methods.

    In conclusion, the choice of research method in social research is a crucial decision that requires careful consideration of research objectives, practical constraints, and philosophical assumptions. By thoughtfully selecting appropriate methods, researchers can ensure that their studies contribute meaningful insights to the field of social sciences.

    References:

    Matthews, B., & Ross, L. (2010). Research methods: A practical guide for the social sciences. Pearson Education.

    Scribbr. (n.d.). Qualitative vs. Quantitative Research | Differences, Examples & Methods.

    Simply Psychology. (2023). Qualitative vs Quantitative Research: What’s the Difference?

    National University. (2024). What Is Qualitative vs. Quantitative Study?

    Citations:
    [1] https://www.scribbr.com/methodology/qualitative-quantitative-research/
    [2] https://researcher.life/blog/article/qualitative-vs-quantitative-research/
    [3] https://www.simplypsychology.org/qualitative-quantitative.html
    [4] https://www.nu.edu/blog/qualitative-vs-quantitative-study/
    [5] https://pmc.ncbi.nlm.nih.gov/articles/PMC3327344/
    [6] https://www.thesoundhq.com/qualitative-vs-quantitative-research-better-together/
    [7] https://www.fullstory.com/blog/qualitative-vs-quantitative-data/
    [8] https://accelerate.uofuhealth.utah.edu/improvement/understanding-qualitative-and-quantitative-approac

  • Research Questions and Hypothesis (Chapter A4)

    Research questions are essential in guiding a research project. They define the purpose and provide a roadmap for the entire research process. Without clear research questions, it’s difficult to determine what data to collect and how to analyze it effectively.

    There are several types of research questions:

    1. Exploratory: Gain initial insights into new or poorly understood phenomena.
      Example: “What is it like to be a member of a gang?”
    2. Descriptive: Provide detailed accounts of particular phenomena or situations.
      Example: “Who are the young men involved in gun crime?”
    3. Explanatory: Uncover reasons behind phenomena or relationships between factors.
      Example: “Why do young men who join gangs participate in gun-related crime?”
    4. Evaluative: Assess the effectiveness of policies, programs, or interventions.
      Example: “What changes in policy and practice would best help young men not to join such gangs?”

    Research projects often use multiple types of questions for a comprehensive understanding of the topic.

    Hypotheses

    Hypotheses are statements proposing relationships between two or more concepts. They are tested by collecting and analyzing data to determine if they are supported or refuted. Hypotheses are commonly used in quantitative research for statistical testing[1].

    Example hypothesis: “People from ethnic group A are more likely to commit crimes than people from ethnic group B.”

    Operational Definitions

    Before data collection, it’s crucial to develop clear operational definitions. This process involves:

    1. Breaking down broad research questions into specific sub-questions
    2. Defining key concepts in measurable ways

    Operational definitions specify how concepts will be measured or observed in a study. For example, “long-term unemployment” might be defined as “adults aged 16-65 who have been in paid work (at least 35 hours per week) but have not been doing any paid work for more than one year”[2].

    Precise operational definitions ensure:

    • Validity and reliability of research
    • Relevance of collected data
    • Replicability of findings

    Pilot Testing and Subsidiary Questions

    Pilot-testing operational definitions is recommended to check clarity and consistency. This involves trying out definitions with a small group to ensure they are easily understood and consistently interpreted[3].

    As researchers refine definitions and explore literature, they often develop subsidiary research questions. These more specific questions address different aspects of the main research question[4].

    Example subsidiary questions for a study on long-term unemployment and mental health:

    • What specific mental health outcomes are being investigated?
    • What coping mechanisms do individuals experiencing long-term unemployment employ?
    • How does social support mitigate the negative impacts of unemployment?

    Carefully developing research questions, hypotheses, and operational definitions establishes a strong foundation for a focused, rigorous study capable of producing meaningful findings.

  • Concepts and Variables

    Concepts and variables are important components of scientific research (Trochim, 2006). Concepts refer to abstract or general ideas that describe or explain phenomena, while variables are measurable attributes or characteristics that can vary across individuals, groups, or situations. Concepts and variables are used to develop research questions, hypotheses, and operational definitions, and to design and analyze research studies. In this essay, I will discuss the concepts and variables that are commonly used in scientific research, with reference to relevant literature.

    One important concept in scientific research is validity, which refers to the extent to which a measure or test accurately reflects the concept or construct it is intended to measure (Carmines & Zeller, 1979). Validity can be assessed in different ways, including face validity, content validity, criterion-related validity, and construct validity. Face validity refers to the extent to which a measure appears to assess the concept it is intended to measure, while content validity refers to the degree to which a measure covers all the important dimensions of the concept. Criterion-related validity involves comparing a measure to an established standard or criterion, while construct validity involves testing the relationship between a measure and other related constructs.

    Another important concept in scientific research is reliability, which refers to the consistency and stability of a measure over time and across different contexts (Trochim, 2006). Reliability can be assessed in different ways, including test-retest reliability, inter-rater reliability, and internal consistency. Test-retest reliability involves measuring the same individuals on the same measure at different times and examining the degree of consistency between the scores. Inter-rater reliability involves comparing the scores of different raters who are measuring the same variable. Internal consistency involves examining the extent to which different items on a measure are consistent with each other.

    Variables are another important component of scientific research (Shadish, Cook, & Campbell, 2002). Variables are classified into independent variables, dependent variables, and confounding variables. Independent variables are variables that are manipulated by the researcher in order to test their effects on the dependent variable. Dependent variables are variables that are measured by the researcher in order to assess the effects of the independent variable. Confounding variables are variables that may affect the relationship between the independent and dependent variables and need to be controlled for in order to ensure accurate results.

    In summary, concepts and variables are important components of scientific research, providing a framework for developing research questions, hypotheses, and operational definitions, and designing and analyzing research studies. Validity and reliability are important concepts that help to ensure the accuracy and consistency of research measures, while independent, dependent, and confounding variables are important variables that help to assess the effects of different factors on outcomes. Understanding these concepts and variables is essential for conducting rigorous and effective scientific research.

  • Indepth Interview

    Qualitative research interviews are a method used to gather information about people’s experiences, beliefs, attitudes, and perceptions. There are several different types of qualitative research interviews that you can use, each with its own strengths and weaknesses. Here’s an overview of the most common methods:

    1. Structured Interviews: Structured interviews are highly standardized and follow a pre-determined set of questions. This type of interview is often used in surveys, and is best for gathering quantitative data.
    2. Unstructured Interviews: Unstructured interviews are more informal and less standardized. The interviewer does not have a set list of questions, but rather engages in conversation with the interviewee to gather information. This type of interview is best for exploring complex and sensitive topics.
    3. Semi-Structured Interviews: Semi-structured interviews are a compromise between structured and unstructured interviews. They have a general outline of topics to be covered, but the interviewer has the flexibility to delve deeper into specific topics as they arise during the interview.
    4. Focus Group Interviews: Focus group interviews involve bringing together a small group of people to discuss a particular topic or issue. The interviewer facilitates the discussion, but the group dynamic allows for the sharing of different perspectives and experiences.
    5. In-Depth Interviews: In-depth interviews are similar to unstructured interviews, but they tend to be longer and more in-depth. The interviewer will often use open-ended questions and follow-up questions to gather as much information as possible from the interviewee.

    When conducting a qualitative research interview, it is important to follow ethical guidelines and to make sure that the interviewee is comfortable and able to provide informed consent. You should also ensure that the interview is conducted in a private and confidential setting, and that you have a plan for transcribing and analyzing the data you collect. In conclusion, there are several different types of qualitative research interviews, each with its own strengths and weaknesses. The method you choose will depend on the research question, the population you are studying, and the type of data you want to gather. By following ethical guidelines and being respectful of the interviewee, you can conduct effective qualitative research interviews that yield valuable insights and data

  • Conducting effective Focus Groups

    A focus group is a qualitative research method that involves a small, diverse group of people who are brought together to discuss a particular topic or product. The purpose of a focus group is to gather opinions, thoughts, and feedback from the participants in an informal, conversational setting. Conducting a successful focus group requires careful planning and execution, as well as the ability to facilitate and guide the conversation effectively. Here is a step-by-step guide on how to conduct a focus group:

    1. Define the objective: Before conducting a focus group, it is important to have a clear understanding of the purpose and objective of the discussion. This will help guide the selection of participants, the questions to be asked, and the overall structure of the session.
    2. Select participants: Participants should be selected based on the research objectives and the target audience. A diverse group of people with different backgrounds, perspectives, and opinions is ideal, as this can lead to more meaningful discussions.
    3. Choose a location: The location for the focus group should be comfortable, quiet, and private. This will help ensure that participants feel relaxed and can freely express their opinions without distractions.
    4. Prepare questions: Develop a list of open-ended questions that will help guide the discussion. These questions should be relevant to the research objectives and designed to encourage participants to share their opinions and thoughts.
    5. Set the agenda: Establish an agenda for the focus group, including the timing for each question, and any additional activities or exercises that will be conducted. This will help keep the session on track and ensure that all the objectives are met.
    6. Facilitate the discussion: The facilitator should guide the discussion by introducing the objectives and asking questions. It is important to create an open and inclusive environment where all participants feel comfortable sharing their opinions. The facilitator should also encourage active listening and respectful disagreement among participants.
    7. Document the session: Take detailed notes or use audio or video recording equipment to capture the discussion. This will help ensure that the data gathered is accurate and can be used for analysis.
    8. Analyze the data: After the focus group is completed, the data should be analyzed to identify key themes and insights. This information can be used to inform decision-making, product design, and marketing strategies.
  • Think Out Loud

    Qualitative research involves the exploration of individuals’ experiences, attitudes, beliefs, and perceptions to generate insights that can inform various fields. To get the most out of qualitative research, researchers employ various methods to collect, analyze and interpret data. One such method is the think-out-loud method. This page will explain what the think-out-loud method is and how it is used in qualitative research.

    What is the think-out-loud method?

    The think-out-loud method is a qualitative research method that involves asking participants to verbalize their thoughts and feelings as they engage in a particular activity or task. Essentially, participants are asked to “think aloud” as they perform the task, describing their thought processes, decisions, and feelings in real-time. The method is also known as the verbal protocol method, the concurrent verbalization method, or the stimulated recall method.

    How is the think-out-loud method used in qualitative research?

    The think-out-loud method is often used in various fields to collect data that would otherwise be difficult to obtain using other methods. For example, researchers in psychology may use the method to explore cognitive processes, such as decision-making or problem-solving. Market researchers may use the method to understand how consumers make purchasing decisions. Educational researchers may use the method to understand how students approach learning tasks.

    To use the think-out-loud method, researchers typically begin by selecting a task or activity for the participant to complete. The task should be something that the participant can perform without excessive instruction or guidance, such as reading a paragraph or solving a simple math problem. Participants are then asked to verbalize their thoughts and feelings as they complete the task. Researchers can either record the verbalizations for later analysis or transcribe them in real-time.

    Once the data has been collected, researchers can analyze the verbalizations to gain insights into the participants’ thought processes, decision-making strategies, and feelings. Analysis typically involves identifying themes, patterns, and categories that emerge from the data. Researchers may also use the data to generate hypotheses or inform the development of interventions or training programs.

    Benefits and limitations of the think-out-loud method:

    The think-out-loud method has several advantages over other qualitative research methods. One advantage is that it allows researchers to access participants’ thought processes and feelings in real-time, providing a more accurate and detailed picture of how participants approach a task or activity. The method is also relatively easy to administer and does not require extensive training or equipment.

    However, there are also limitations to the think-out-loud method. One limitation is that it may not be suitable for all research questions or tasks. For example, if the task is too complex, participants may struggle to verbalize their thought processes, leading to incomplete or inaccurate data. The method is also time-consuming, and it may be difficult to recruit participants who are willing to engage in the verbalization process.