Tag: Research Methods

  • Digital Presence Scale

    The Digital Presence Scale is a measurement tool that assesses the digital presence of a brand or organization. It evaluates a brand’s performance in terms of digital marketing, social media, website design, and other digital channels. Here is the complete Digital Presence Scale for a magazine, including the questionnaire, sub-categories, scoring, and references:

    Questionnaire:

    1. Does the magazine have a website?
    2. Is the website responsive and mobile-friendly?
    3. Is the website design visually appealing and easy to navigate?
    4. Does the website have a clear and concise mission statement?
    5. Does the website have a blog or content section?
    6. Does the magazine have active social media accounts (e.g., Facebook, Twitter, Instagram, etc.)?
    7. Does the magazine regularly post content on their social media accounts?
    8. Does the magazine engage with their followers on social media (e.g., responding to comments and messages)?
    9. Does the magazine have an email newsletter or mailing list?
    10. Does the magazine have an e-commerce platform or online store?

    Sub-categories:

    1. Website design and functionality
    2. Website content and messaging
    3. Social media presence and engagement
    4. Email marketing and communication
    5. E-commerce and digital revenue streams

    Scoring:

    For each question, the magazine can score a maximum of 2 points. A score of 2 indicates that the magazine fully meets the criteria, while a score of 1 indicates partial compliance, and a score of 0 indicates non-compliance.

    References:

    The Digital Presence Scale is a measurement tool developed by the International Journal of Information Management. The sub-categories and questions for a magazine were adapted from existing literature on digital marketing and media.

  • Brand Attitude Scale

    Introduction:

    Brand attitude refers to the overall evaluation of a brand based on the individual’s beliefs, feelings, and behavioral intentions towards the brand. It is an essential aspect of consumer behavior and marketing, as it influences the purchase decisions of consumers. In this essay, we will explore the concept of brand attitude, its sub-concepts, and how it is measured. We will also discuss criticisms and limitations of this concept.

    Sub-Concepts of Brand Attitude:

    The sub-concepts of brand attitude include cognitive, affective, and conative components. The cognitive component refers to the beliefs and knowledge about the brand, including its features, attributes, and benefits. The affective component represents the emotional response of the consumer towards the brand, such as feelings of liking, disliking, or indifference. Finally, the conative component represents the behavioral intention of the consumer towards the brand, such as the likelihood of buying or recommending the brand to others.

    Measurement of Brand Attitude:

    There are several ways to measure brand attitude, including self-report measures, behavioral measures, and physiological measures. Self-report measures are the most common method of measuring brand attitude and involve asking consumers to rate their beliefs, feelings, and behavioral intentions towards the brand using a Likert scale or other rating scales.

    One of the most widely used self-report measures of brand attitude is the Brand Attitude Scale (BAS), developed by Richard Lutz in 1975. The BAS is a six-item scale that measures the cognitive, affective, and conative components of brand attitude. Another commonly used measure is the Brand Personality Scale (BPS), developed by Jennifer Aaker in 1997, which measures the personality traits associated with a brand.

    Criticism of Brand Attitude:

    One criticism of brand attitude is that it is too simplistic and does not account for the complexity of consumer behavior. Critics argue that consumers’ evaluations of brands are influenced by a wide range of factors, including social and cultural factors, brand associations, and personal values. Therefore, brand attitude alone may not be sufficient to explain consumers’ behavior towards a brand.

    Another criticism of brand attitude is that it may be subject to social desirability bias. Consumers may give socially desirable responses to questions about their attitude towards a brand, rather than their genuine beliefs and feelings. This bias may result in inaccurate measurements of brand attitude.

    Conclusion:

    Brand attitude is an essential concept in consumer behavior and marketing. It refers to the overall evaluation of a brand based on the individual’s beliefs, feelings, and behavioral intentions towards the brand. The sub-concepts of brand attitude include cognitive, affective, and conative components. There are several ways to measure brand attitude, including self-report measures, behavioral measures, and physiological measures. The Brand Attitude Scale (BAS) and the Brand Personality Scale (BPS) are two commonly used measures of brand attitude. However, the concept of brand attitude is not without its criticisms, including its simplicity and susceptibility to social desirability bias. Despite these criticisms, brand attitude remains a valuable concept for understanding consumer behavior and developing effective marketing strategies.

    References:

    Aaker, J. (1997). Dimensions of brand personality. Journal of marketing research, 34(3), 347-356.

    Lutz, R. J. (1975). Changing brand attitudes through modification of cognitive structure. Journal of consumer research, 1(4), 49-59.

    Punj, G. N., & Stewart, D. W. (1983). An interactionist approach to the theory of brand choice. Journal of Consumer Research, 10(3), 281-299.

    Questionaire

    The Brand Attitude Scale (BAS) is a self-report measure used to assess the cognitive, affective, and conative components of brand attitude. The scale consists of six items, each rated on a seven-point Likert scale ranging from 1 (strongly disagree) to 7 (strongly agree). The complete BAS is as follows:

    1. I believe that the [brand name] is a high-quality product.
    2. I feel positive about the [brand name].
    3. I would recommend the [brand name] to others.
    4. I have confidence in the [brand name].
    5. I trust the [brand name].
    6. I would consider buying the [brand name] in the future.

    To score the BAS, the scores for each item are summed, with higher scores indicating a more positive brand attitude. The possible range of scores on the BAS is from 6 to 42, with higher scores indicating a more positive brand attitude. The reliability and validity of the BAS have been established in previous research, making it a widely used and validated measure of brand attitude.
  • Brand Perception Scale

    In today’s competitive business environment, building a strong brand has become a top priority for companies across various industries. Brand perception is one of the key components of branding, and it plays a critical role in shaping how consumers perceive a brand. Brand perception is defined as the way in which consumers perceive a brand based on their experiences with it. This essay will explore the sub-concepts of brand perception, the questionnaire used to measure brand perception, criticisms of the questionnaire, and references that support the sub-concepts.

    Sub-Concepts of Brand Perception

    Brand perception is comprised of several sub-concepts that help to shape the overall perception of a brand. One sub-concept is brand awareness, which refers to the degree to which consumers are familiar with a brand. Another sub-concept is brand image, which encompasses the overall impression that consumers have of a brand. Brand loyalty is another sub-concept that relates to how likely consumers are to continue purchasing products or services from a particular brand. Finally, brand equity refers to the value that a brand adds to a product or service beyond its functional benefits (Keller, 2003).

    Questionnaire used to Measure Brand Perception

    To measure brand perception, a questionnaire was developed that includes several sub-concepts. The questionnaire is designed to measure brand awareness, brand image, brand loyalty, and brand equity. The following is an overview of the sub-concepts included in the questionnaire:

    Brand Awareness: This sub-concept includes questions that measure the degree to which consumers are familiar with a brand. For example, “Have you heard of brand X?” or “Have you ever purchased a product from brand X?”

    Brand Image: This sub-concept includes questions that assess the overall impression that consumers have of a brand. For example, “What words or phrases come to mind when you think of brand X?” or “How would you describe the personality of brand X?”

    Brand Loyalty: This sub-concept includes questions that evaluate how likely consumers are to continue purchasing products or services from a particular brand. For example, “How likely are you to recommend brand X to a friend?” or “How likely are you to purchase from brand X again in the future?”

    Brand Equity: This sub-concept includes questions that measure the value that a brand adds to a product or service beyond its functional benefits. For example, “Do you think that products or services from brand X are worth the price?” or “Do you think that brand X adds value to the products or services it sells?”

    Criticism of the Questionnaire

    One criticism of the questionnaire is that it relies heavily on self-reported data, which can be subject to bias. Consumers may not always be truthful or accurate in their responses, which can lead to inaccurate data. Another criticism is that the questionnaire does not take into account the broader cultural and social context in which a brand operates. Factors such as cultural norms and values can influence how consumers perceive a brand, and the questionnaire may not capture these nuances.

    References

    Keller, K. L. (2003). Strategic brand management: Building, measuring, and managing brand equity. Upper Saddle River, NJ: Prentice Hall

    Questionaire 

    Brand Perception Questionnaire

    Part 1: Brand Awareness

    1. Have you heard of brand X? a. Yes – 1 point b. No – 0 points
    2. Have you ever purchased a product from brand X? a. Yes – 1 point b. No – 0 points

    Part 2: Brand Image 3. What words or phrases come to mind when you think of brand X? (Open-ended) a. Positive or neutral words/phrases (e.g., reliable, high-quality, innovative, etc.) – 1 point each b. Negative words/phrases (e.g., unreliable, poor-quality, outdated, etc.) – -1 point each c. No words/phrases mentioned – 0 points

    1. How would you describe the personality of brand X? a. Positive or neutral personality traits (e.g., trustworthy, friendly, professional, etc.) – 1 point each b. Negative personality traits (e.g., untrustworthy, unfriendly, unprofessional, etc.) – -1 point each c. No personality traits mentioned – 0 points

    Part 3: Brand Loyalty 5. How likely are you to recommend brand X to a friend? a. Very likely – 2 points b. Somewhat likely – 1 point c. Not likely – 0 points

    1. How likely are you to purchase from brand X again in the future? a. Very likely – 2 points b. Somewhat likely – 1 point c. Not likely – 0 points

    Part 4: Brand Equity 7. Do you think that products or services from brand X are worth the price? a. Yes – 1 point b. No – 0 points

    1. Do you think that brand X adds value to the products or services it sells? a. Yes – 1 point b. No – 0 points

    Scoring Rules and Categories:

    Brand Awareness:

    • Total score can range from 0-2
    • A score of 2 indicates high brand awareness, while a score of 0 indicates low brand awareness.

    Brand Image:

    • Total score can range from -4 to +4
    • A score of +4 indicates a highly positive brand image, while a score of -4 indicates a highly negative brand image.
    • A score of 0 indicates a neutral brand image.

    Brand Loyalty:

    • Total score can range from 0-4
    • A score of 4 indicates high brand loyalty, while a score of 0 indicates low brand loyalty.

    Brand Equity:

    • Total score can range from 0-2
    • A score of 2 indicates high brand equity, while a score of 0 indicates low brand equity.

    Overall Brand Perception:

    • To determine overall brand perception, add the scores from each sub-concept (Brand Awareness, Brand Image, Brand Loyalty, and Brand Equity).
    • Total score can range from -8 to +12
    • A score of +12 indicates a highly positive overall brand perception, while a score of -8 indicates a highly negative overall brand perception.
    • A score of 0 indicates a neutral overall brand perception.
  • Mindful Attention Awareness Scale (MAAS)

    Mindfulness has become an increasingly popular concept in recent years, as people strive to find ways to reduce stress, increase focus, and improve their overall wellbeing. One of the most widely used tools for measuring mindfulness is the Mindful Attention Awareness Scale (MAAS), developed by J. Brown and R. Ryan in 2003. In this blog post, we will explore the MAAS and its different scales to help you better understand how it can be used to measure mindfulness.

    The MAAS is a 15-item scale designed to measure the extent to which individuals are able to maintain a non-judgmental and present-focused attention to their thoughts and sensations in daily life. The scale consists of statements that are rated on a six-point scale ranging from 1 (almost always) to 6 (almost never). Respondents are asked to indicate how frequently they have experienced each statement over the past week.

    The MAAS is divided into three subscales, which can be used to measure different aspects of mindfulness. The first subscale is the Attention subscale, which measures the extent to which individuals are able to maintain their focus on the present moment. The second subscale is the Awareness subscale, which measures the extent to which individuals are able to notice their thoughts and sensations without judging them. The third subscale is the Acceptance subscale, which measures the extent to which individuals are able to accept their thoughts and feelings without trying to change them.

    Each subscale of the MAAS consists of five items. Here are the items included in each subscale:

    Attention Subscale:

    1. I find myself doing things without paying attention.
    2. I drive places on “automatic pilot” and then wonder why I went there.
    3. I find myself easily distracted during tasks.
    4. I tend not to notice feelings of physical tension or discomfort until they really grab my attention.
    5. I rush through activities without being really attentive to them.

    Awareness Subscale:

    1. I could be experiencing some emotion and not be conscious of it until sometime later.
    2. I break or spill things because of carelessness, not paying attention, or thinking of something else.
    3. I find it difficult to stay focused on what’s happening in the present.
    4. I find myself preoccupied with the future or the past.
    5. I find myself listening to someone with one ear, doing something else at the same time.

    Acceptance Subscale:

    1. I tell myself that I shouldn’t be feeling the way that I’m feeling.
    2. When I fail at something important to me I become consumed by feelings of inadequacy.
    3. When I’m feeling down I tend to obsess and fixate on everything
  • Concepts and Variables

    Concepts and variables are two key terms that play a significant role in media studies. While the two terms may appear similar, they serve distinct purposes and meanings. Understanding the differences between concepts and variables is essential for media studies scholars and students. In this blog post, we will explore the distinctions between concepts and variables in the context of media studies. 

    Concepts: 

    Concepts are abstract ideas that help to classify and describe phenomena. They are essential in media studies as they help in creating an understanding of the objects of study. Concepts are used to develop mental models of media objects, to analyze and critique them. For example, concepts such as “representation” and “power” are used to describe and understand how media texts work (Kellner, 2015). 

    Variables: 

    Variables, on the other hand, are used to store data in a program or research. They are crucial in media studies research as they help in collecting and analyzing data. Variables are named containers that hold a specific value, such as numerical or textual data. Variables can be manipulated and changed during the research process. For example, variables such as age, gender, and socio-economic status can be used to collect data and analyze the relationship between media and society (Morgan & Shanahan, 2010). 

    Differences: 

    One of the significant differences between concepts and variables is that concepts are abstract while variables are concrete. Concepts are used to create mental models that help to understand and analyze media objects, while variables are used to collect and analyze data in research. Another difference is that concepts are broader and at a higher level than variables. Concepts are used to describe the overall structure and design of media texts, while variables are used to study specific aspects of media objects. 

    In addition, concepts are often used to group together related variables in media studies research. For example, the concept of “media effects” might be used to group variables such as exposure to media, attitude change, and behavior change. By grouping related variables together, researchers can have a better understanding of the complex relationships between variables and concepts in media studies research. 

    Concepts and Variables are two essential components of media studies research. Concepts help to develop mental models of media objects, while variables are used to collect and analyze data in research. By understanding the differences between these two terms, media studies scholars and students can create more effective and efficient research.

  • Type I and Type II errors

    Type I and Type II errors are two statistical concepts that are highly relevant to the media industry. These errors refer to the mistakes that can be made when interpreting data, which can have significant consequences for media reporting and analysis.

    Type I error, also known as a false positive, occurs when a researcher or analyst concludes that there is a statistically significant result, when in fact there is no such result. This error is commonly associated with over-interpreting data, and can lead to false or misleading conclusions being presented to the public. In the media industry, Type I errors can occur when journalists or media outlets report on studies or surveys that claim to have found a significant correlation or causation between two variables, but in reality, the relationship between those variables is weak or non-existent.

    For example, a study may claim that there is a strong link between watching violent TV shows and aggressive behavior in children. If the study’s findings are not thoroughly scrutinized, media outlets may report on this correlation as if it is a causal relationship, potentially leading to a public outcry or calls for increased censorship of violent media. In reality, the study may have suffered from a Type I error, and the relationship between violent TV shows and aggressive behavior in children may be much weaker than initially suggested.

    Type II error, also known as a false negative, occurs when a researcher or analyst fails to identify a statistically significant result, when in fact there is one. This error is commonly associated with under-interpreting data, and can lead to important findings being overlooked or dismissed. In the media industry, Type II errors can occur when journalists or media outlets fail to report on studies or surveys that have found significant correlations or causations between variables, potentially leading to important information being missed by the public.

    An example of a Type II error in the media industry could be conducting a study on the impact of a certain type of advertising on consumer behavior, but failing to detect a statistically significant effect, even though there may be a true effect present in the population.

    For instance, a media company may conduct a study to determine if their online ads are more effective than their TV ads in generating sales. The study finds no significant difference in sales generated by either type of ad. However, in reality, there may be a significant difference in sales generated by the two types of ads, but the sample size of the study was too small to detect this difference. This would be an example of a Type II error, as a significant effect exists in the population, but was not detected in the sample studied.

    If the media company makes decisions based on the results of this study, such as reallocating their advertising budget away from TV ads and towards online ads, they may be making a mistake due to the failure to detect the true effect. This could lead to missed opportunities for revenue and reduced effectiveness of their advertising campaigns.

    In summary, a Type II error in the media industry could occur when a study fails to detect a significant effect that is present in the population, leading to potential missed opportunities and incorrect decision-making.

    To avoid Type I and Type II errors in the media industry, here are some suggestions:

    1. Careful study design: It is important to carefully design studies or surveys in order to avoid Type I and Type II errors. This includes considering sample size, control variables, and statistical methods to be used.
    2. Thorough data analysis: Thoroughly analyzing data is crucial in order to identify potential errors or biases. This can include using appropriate statistical methods and tests, as well as conducting sensitivity analyses to assess the robustness of findings.
    3. Peer review: Having studies or reports peer-reviewed by experts in the field can help to identify potential errors or biases, and ensure that findings are accurate and reliable.
    4. Transparency and replicability: Being transparent about study methods, data collection, and analysis can help to minimize the risk of errors or biases. It is also important to ensure that studies can be replicated by other researchers, as this can help to validate findings and identify potential errors.
    5. Independent verification: Independent verification of findings can help to confirm the accuracy and validity of results. This can include having studies replicated by other researchers or having data analyzed by independent experts.

    By following these suggestions, media professionals can help to minimize the risk of Type I and Type II errors in their reporting and analysis. This can help to ensure that the public is provided with accurate and reliable information, and that important decisions are made based on sound evidence

  • Methods of Conducting Quantitative Research

    Quantitative research is a type of research that uses numerical data and statistical analysis to understand and explain phenomena. It is a systematic and objective method of collecting, analyzing, and interpreting data to answer research questions and test hypotheses.

    conduct

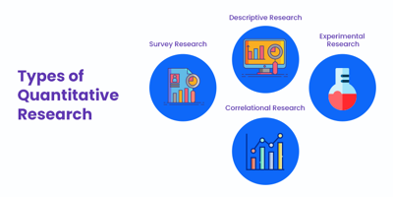
    The following are some of the commonly used methods for conducting quantitative research:

    1. Survey research: This method involves collecting data from a large number of individuals through self-administered questionnaires or interviews. Surveys can be administered in person, by mail, by phone, or online.
    2. Experimental research: In experimental research, the researcher manipulates an independent variable to observe the effect on a dependent variable. The goal is to establish cause-and-effect relationships between variables.
    3. Quasi-experimental research: This method is similar to experimental research, but the researcher does not have full control over the assignment of participants to groups.
    4. Correlational research: This method involves examining the relationship between two or more variables without manipulating any of them. The goal is to identify patterns of association between variables.
    5. Longitudinal research: This method involves collecting data from the same individuals over an extended period of time. The goal is to study changes in variables over time and understand the underlying processes.
    6. Cross-sectional research: This method involves collecting data from different individuals at the same point in time. The goal is to study differences between groups and understand the prevalence of variables in a population.
    7. Case study research: This method involves in-depth examination of a single individual or group. The goal is to gain a comprehensive understanding of a phenomenon.

    It is important to choose the appropriate method based on the research question and the type of data being analyzed. For example, if the goal is to establish cause-and-effect relationships, an experimental design is more appropriate than a survey design.

    Quantitative research is a valuable tool for understanding and explaining phenomena in a systematic and objective way. By selecting the appropriate method, researchers can collect and analyze data to answer their research questions and test hypotheses.