Concepts and variables are two key terms that play a significant role in media studies. While the two terms may appear similar, they serve distinct purposes and meanings. Understanding the differences between concepts and variables is essential for media studies scholars and students. In this blog post, we will explore the distinctions between concepts and variables in the context of media studies.
Concepts:
Concepts are abstract ideas that help to classify and describe phenomena. They are essential in media studies as they help in creating an understanding of the objects of study. Concepts are used to develop mental models of media objects, to analyze and critique them. For example, concepts such as “representation” and “power” are used to describe and understand how media texts work (Kellner, 2015).
Variables:
Variables, on the other hand, are used to store data in a program or research. They are crucial in media studies research as they help in collecting and analyzing data. Variables are named containers that hold a specific value, such as numerical or textual data. Variables can be manipulated and changed during the research process. For example, variables such as age, gender, and socio-economic status can be used to collect data and analyze the relationship between media and society (Morgan & Shanahan, 2010).
Differences:
One of the significant differences between concepts and variables is that concepts are abstract while variables are concrete. Concepts are used to create mental models that help to understand and analyze media objects, while variables are used to collect and analyze data in research. Another difference is that concepts are broader and at a higher level than variables. Concepts are used to describe the overall structure and design of media texts, while variables are used to study specific aspects of media objects.
In addition, concepts are often used to group together related variables in media studies research. For example, the concept of “media effects” might be used to group variables such as exposure to media, attitude change, and behavior change. By grouping related variables together, researchers can have a better understanding of the complex relationships between variables and concepts in media studies research.
Concepts and Variables are two essential components of media studies research. Concepts help to develop mental models of media objects, while variables are used to collect and analyze data in research. By understanding the differences between these two terms, media studies scholars and students can create more effective and efficient research.
Type I and Type II errors are two statistical concepts that are highly relevant to the media industry. These errors refer to the mistakes that can be made when interpreting data, which can have significant consequences for media reporting and analysis.
Type I error, also known as a false positive, occurs when a researcher or analyst concludes that there is a statistically significant result, when in fact there is no such result. This error is commonly associated with over-interpreting data, and can lead to false or misleading conclusions being presented to the public. In the media industry, Type I errors can occur when journalists or media outlets report on studies or surveys that claim to have found a significant correlation or causation between two variables, but in reality, the relationship between those variables is weak or non-existent.
For example, a study may claim that there is a strong link between watching violent TV shows and aggressive behavior in children. If the study’s findings are not thoroughly scrutinized, media outlets may report on this correlation as if it is a causal relationship, potentially leading to a public outcry or calls for increased censorship of violent media. In reality, the study may have suffered from a Type I error, and the relationship between violent TV shows and aggressive behavior in children may be much weaker than initially suggested.
Type II error, also known as a false negative, occurs when a researcher or analyst fails to identify a statistically significant result, when in fact there is one. This error is commonly associated with under-interpreting data, and can lead to important findings being overlooked or dismissed. In the media industry, Type II errors can occur when journalists or media outlets fail to report on studies or surveys that have found significant correlations or causations between variables, potentially leading to important information being missed by the public.
An example of a Type II error in the media industry could be conducting a study on the impact of a certain type of advertising on consumer behavior, but failing to detect a statistically significant effect, even though there may be a true effect present in the population.
For instance, a media company may conduct a study to determine if their online ads are more effective than their TV ads in generating sales. The study finds no significant difference in sales generated by either type of ad. However, in reality, there may be a significant difference in sales generated by the two types of ads, but the sample size of the study was too small to detect this difference. This would be an example of a Type II error, as a significant effect exists in the population, but was not detected in the sample studied.
If the media company makes decisions based on the results of this study, such as reallocating their advertising budget away from TV ads and towards online ads, they may be making a mistake due to the failure to detect the true effect. This could lead to missed opportunities for revenue and reduced effectiveness of their advertising campaigns.
In summary, a Type II error in the media industry could occur when a study fails to detect a significant effect that is present in the population, leading to potential missed opportunities and incorrect decision-making.
To avoid Type I and Type II errors in the media industry, here are some suggestions:
Careful study design: It is important to carefully design studies or surveys in order to avoid Type I and Type II errors. This includes considering sample size, control variables, and statistical methods to be used.
Thorough data analysis: Thoroughly analyzing data is crucial in order to identify potential errors or biases. This can include using appropriate statistical methods and tests, as well as conducting sensitivity analyses to assess the robustness of findings.
Peer review: Having studies or reports peer-reviewed by experts in the field can help to identify potential errors or biases, and ensure that findings are accurate and reliable.
Transparency and replicability: Being transparent about study methods, data collection, and analysis can help to minimize the risk of errors or biases. It is also important to ensure that studies can be replicated by other researchers, as this can help to validate findings and identify potential errors.
Independent verification: Independent verification of findings can help to confirm the accuracy and validity of results. This can include having studies replicated by other researchers or having data analyzed by independent experts.
By following these suggestions, media professionals can help to minimize the risk of Type I and Type II errors in their reporting and analysis. This can help to ensure that the public is provided with accurate and reliable information, and that important decisions are made based on sound evidence
Transparency in research is a vital aspect of ensuring the validity and credibility of the findings. A transparent research process means that the research methods, data, and results are openly available to the public and can be easily replicated and verified by other researchers. In this section, we will elaborate on the different aspects that lead to transparency in research.
Research Design and Methods: Transparency in research begins with a clear and concise description of the research design and methods used. This includes stating the research question, objectives, and hypothesis, as well as the sampling techniques, data collection methods, and statistical analysis procedures. Researchers should also provide a detailed explanation of any potential limitations or biases in the study, including any sources of error.
Data Availability: One of the critical aspects of transparency in research is data availability. Providing access to the raw data used in the research allows other researchers to verify the findings and conduct further analysis on the data. Data sharing should be done in a secure and ethical manner, following relevant data protection laws and regulations. Open access to data can also facilitate transparency and accountability, promoting public trust in the research process.
Reporting of Findings: To ensure transparency, researchers should provide a clear and detailed report of their findings. This includes presenting the results in a way that is easy to understand, providing supporting evidence such as graphs, charts, and tables, and explaining any potential confounding variables or alternative explanations for the findings. A transparent reporting of findings also means acknowledging any limitations or weaknesses in the research process.
Conflicts of Interest: Transparency in research also requires that researchers disclose any conflicts of interest that may influence the research process or findings. This includes any funding sources, affiliations, or personal interests that may impact the research. Disclosing conflicts of interest maintains the credibility of the research and prevents any perception of bias.
Open Communication: Finally, researchers should engage in open and transparent communication with other researchers and the public. This includes sharing findings through open access publications and presenting findings at conferences and public events. Researchers should also be open to feedback and criticism, as this can help improve the quality of the research. Open communication also promotes accountability, transparency, and trust in the research process.
In conclusion, transparency in research is essential to ensure the validity and credibility of the findings. To achieve transparency, researchers should provide a clear description of the research design and methods, make data openly available, provide a detailed report of findings, disclose any conflicts of interest, and engage in open communication with others. Following these practices enhances the quality and impact of the research, promoting public trust in the research process.
Examples
Research Design and Methods: Example: A study on the impact of a new teaching method on student performance clearly states the research question, objectives, and hypothesis, as well as the sampling techniques, data collection methods, and statistical analysis procedures used. The researchers also explain any potential limitations or biases in the study, such as the limited sample size or potential confounding variables.
Data Availability: Example: A study on the effects of a new drug on a particular disease makes the raw data available to other researchers, including any code used to clean and analyze the data. The data is shared in a secure and ethical manner, following relevant data protection laws and regulations, and can be accessed through an online data repository.
Reporting of Findings: Example: A study on the relationship between social media use and mental health provides a clear and detailed report of the findings, presenting the results in a way that is easy to understand and providing supporting evidence such as graphs and tables. The researchers also explain any potential confounding variables or alternative explanations for the findings and acknowledge any limitations or weaknesses in the research process.
Conflicts of Interest: Example: A study on the safety of a new vaccine discloses that the research was funded by the vaccine manufacturer. The researchers acknowledge the potential for bias and take steps to ensure the validity and credibility of the findings, such as involving independent reviewers in the research process.
Open Communication: Example: A study on the effectiveness of a new cancer treatment presents the findings at a public conference, engaging in open and transparent communication with other researchers and the public. The researchers are open to feedback and criticism, responding to questions and concerns from the audience and taking steps to address any limitations or weaknesses in the research process. The findings are also published in an open access journal, promoting transparency and accountability.
You may read this TIP Sheet from start to finish before you begin your paper, or skip to the steps that are causing you the most grief.
1. Choosing a topic: Interest, information, and focus Your job will be more pleasant, and you will be more apt to retain information if you choose a topic that holds your interest. Even if a general topic is assigned (“Write about impacts of GMO crops on world food supply”), as much as possible find an approach that suits your interests. Your topic should be one on which you can find adequate information; you might need to do some preliminary research to determine this. Go to the Reader’s Guide to Periodical Literature in the reference section of the library, or to an electronic database such as Proquest or Wilson Web, and search for your topic. The Butte College Library Reference Librarians are more than happy to assist you at this (or any) stage of your research. Scan the results to see how much information has been published. Then, narrow your topic to manageable size:
Too Broad: Childhood diseases
Too Broad: Eating disorders
Focused: Juvenile Diabetes
Focused: Anorexia Nervosa
Once you have decided on a topic and determined that enough information is available, you are ready to proceed. At this point, however, if you are having difficulty finding adequate quality information, stop wasting your time; find another topic.
2. Preliminary reading & recordkeeping Gather some index cards or a small notebook and keep them with you as you read. First read a general article on your topic, for example from an encyclopedia. On an index card or in the notebook, record the author, article and/or book title, and all publication information in the correct format (MLA or APA, for example) specified by your instructor. (If you need to know what publication information is needed for the various types of sources, see a writing guide such as SF Writer.) On the index cards or in your notebook, write down information you want to use from each identified source, including page numbers. Use quotation marks on anything you copy exactly, so you can distinguish later between exact quotes and paraphrasing. (You will still attribute information you have quoted or paraphrased.)
Some students use a particular index card method throughout the process of researching and writing that allows them great flexibility in organizing and re-organizing as well as in keeping track of sources; others color-code or otherwise identify groups of facts. Use any method that works for you in later drafting your paper, but always start with good recordkeeping.
3. Organizing: Mind map or outline Based on your preliminary reading, draw up a working mind map or outline. Include any important, interesting, or provocative points, including your own ideas about the topic. A mind map is less linear and may even include questions you want to find answers to. Use the method that works best for you. The object is simply to group ideas in logically related groups. You may revise this mind map or outline at any time; it is much easier to reorganize a paper by crossing out or adding sections to a mind map or outline than it is to laboriously start over with the writing itself.
4. Formulating a thesis: Focus and craftsmanship Write a well defined, focused, three- to five-point thesis statement, but be prepared to revise it later if necessary. Take your time crafting this statement into one or two sentences, for it will control the direction and development of your entire paper.
For more on developing thesis statements, see the TIP Sheets “Developing a Thesis and Supporting Arguments” and “How to Structure an Essay.”
5. Researching: Facts and examples Now begin your heavy-duty research. Try the internet, electronic databases, reference books, newspaper articles, and books for a balance of sources. For each source, write down on an index card (or on a separate page of your notebook) the publication information you will need for your works cited (MLA) or bibliography (APA) page. Write important points, details, and examples, always distinguishing between direct quotes and paraphrasing. As you read, remember that an expert opinion is more valid than a general opinion, and for some topics (in science and history, for example), more recent research may be more valuable than older research. Avoid relying too heavily on internet sources, which vary widely in quality and authority and sometimes even disappear before you can complete your paper.
Never copy-and-paste from internet sources directly into any actual draft of your paper. For more information on plagiarism, obtain from the Butte College Student Services office a copy of the college’s policy on plagiarism, or attend the Critical Skills Plagiarism Workshop given each semester.
6. Rethinking: Matching mind map and thesis After you have read deeply and gathered plenty of information, expand or revise your working mind map or outline by adding information, explanations, and examples. Aim for balance in developing each of your main points (they should be spelled out in your thesis statement). Return to the library for additional information if it is needed to evenly develop these points, or revise your thesis statement to better reflect what you have learned or the direction your paper seems to have taken.
7. Drafting: Beginning in the middle Write the body of the paper, starting with the thesis statement and omitting for now the introduction (unless you already know exactly how to begin, but few writers do). Use supporting detail to logically and systematically validate your thesis statement. For now, omit the conclusion also.
For more on systematically developing a thesis statement, see TIP sheets “Developing a Thesis and Supporting Arguments” and “How to Structure an Essay.”
8. Revising: Organization and attribution Read, revise, and make sure that your ideas are clearly organized and that they support your thesis statement. Every single paragraph should have a single topic that is derived from the thesis statement. If any paragraph does not, take it out, or revise your thesis if you think it is warranted. Check that you have quoted and paraphrased accurately, and that you have acknowledged your sources even for your paraphrasing. Every single idea that did not come to you as a personal epiphany or as a result of your own methodical reasoning should be attributed to its owner.
For more on writing papers that stay on-topic, see the TIP Sheets “Developing a Thesis and Supporting Arguments” and “How to Structure an Essay.” For more on avoiding plagiarism, see the Butte College Student Services brochure, “Academic Honesty at Butte College,” or attend the Critical Skills Plagiarism Workshop given each semester.
9. Writing: Intro, conclusion, and citations Write the final draft. Add a one-paragraph introduction and a one-paragraph conclusion. Usually the thesis statement appears as the last sentence or two of the first, introductory paragraph. Make sure all citations appear in the correct format for the style (MLA, APA) you are using. The conclusion should not simply restate your thesis, but should refer to it. (For more on writing conclusions, see the TIP Sheet “How to Structure an Essay.”) Add a Works Cited (for MLA) or Bibliography (for APA) page.
10. Proofreading: Time and objectivity Time permitting, allow a few days to elapse between the time you finish writing your last draft and the time you begin to make final corrections. This “time out” will make you more perceptive, more objective, and more critical. On your final read, check for grammar, punctuation, correct word choice, adequate and smooth transitions, sentence structure, and sentence variety. For further proofreading strategies, see the TIP Sheet “Revising, Editing, and Proofreading.”
Sampling error is a statistical concept that occurs when a sample of a population is used to make inferences about the entire population, but the sample doesn’t accurately represent the population. This can happen due to a variety of reasons, such as the sample size being too small or the sampling method being biased. In this essay, I will explain sampling error to media students, provide examples, and discuss the effects it can have.
When conducting research in media studies, it’s essential to have a sample that accurately represents the population being studied. For example, if a media student is researching the viewing habits of teenagers in the United States, it’s important to ensure that the sample of teenagers used in the study is diverse enough to represent the larger population of all teenagers in the United States. If the sample isn’t representative of the population, the results of the study can be misleading, and the conclusions drawn from the study may not be accurate.
One of the most common types of sampling error is called selection bias. This occurs when the sample used in a study is not randomly selected from the population being studied, but instead is selected in a way that skews the results. For example, if a media student is conducting a study on the viewing habits of teenagers in the United States, but the sample is taken only from affluent suburbs, the results of the study may not be representative of all teenagers in the United States.
Another type of sampling error is called measurement bias. This occurs when the measurements used in the study are not accurate or precise enough to provide an accurate representation of the population being studied. For example, if a media student is conducting a study on the amount of time teenagers spend watching television, but the measurement tool used only asks about prime time viewing habits, the results of the study may not accurately represent the total amount of time teenagers spend watching television.
Sampling error can have a significant effect on the conclusions drawn from a study. If the sample used in a study is not representative of the population being studied, the results of the study may not accurately reflect the true state of the population. This can lead to incorrect conclusions being drawn from the study, which can have negative consequences. For example, if a media student conducts a study on the viewing habits of teenagers in the United States and concludes that they watch more reality TV shows than any other type of programming, but the sample used in the study was biased toward a particular demographic, such as affluent suburban teenagers, the conclusions drawn from the study may not accurately reflect the true viewing habits of all teenagers in the United States. Sampling error is a significant issue in media studies and can have a profound effect on the conclusions drawn from a study. Media students need to ensure that the samples used in their research are representative of the populations being studied and that the measurements used in their research are accurate and precise. By doing so, media students can ensure that their research accurately reflects the state of the populations being studied and that the conclusions drawn from their research are valid.
Replicability is a key aspect of scientific research that ensures the validity and reliability of results. In media studies, replicability is particularly important because of the subjective nature of many of the topics studied. This essay will discuss the importance of replicability in research for media students and provide examples of studies that have successfully achieved replicability.
Replicability is the ability to reproduce the results of a study by using the same methods and procedures as the original study. It is an important aspect of scientific research because it ensures that the findings of a study are reliable and can be used to make informed decisions. Replicability also allows researchers to test the validity of their findings and helps to establish a foundation of knowledge that can be built upon by future research.
In media studies, replicability is particularly important because of the subjective nature of the topics studied. Media studies often focus on the interpretation of media content by audiences and the effects of media on society. These topics can be difficult to study because they are influenced by a variety of factors, including culture, personal beliefs, and individual experiences. Replicability ensures that studies in media studies are conducted in a systematic and controlled manner, which reduces the impact of these factors on the results.
One example of a study that successfully achieved replicability in media studies is the cultivation theory developed by George Gerbner. Cultivation theory proposes that television viewers’ perceptions of reality are shaped by the amount and nature of the content they are exposed to on television. In a series of studies conducted over several decades, Gerbner and his colleagues found that heavy television viewers are more likely to overestimate the amount of crime and violence in society and have a more fearful view of the world. These findings have been replicated in numerous studies, which has helped to establish the cultivation theory as a robust and reliable explanation of the effects of television on viewers.
Another example of a study that achieved replicability in media studies is the uses and gratifications theory developed by Elihu Katz and Jay Blumler. The uses and gratifications theory proposes that audiences actively choose and use media to fulfill specific needs, such as information, entertainment, or social interaction. In a series of studies conducted over several decades, Katz and his colleagues found that audiences’ media use is influenced by a variety of factors, including individual needs, social and cultural norms, and media characteristics. These findings have been replicated in numerous studies, which has helped to establish the uses and gratifications theory as a robust and reliable explanation of audience behavior.
Replicability is a critical aspect of scientific research that ensures the validity and reliability of results. In media studies, replicability is particularly important because of the subjective nature of many of the topics studied. Successful examples of replicability in media studies include the cultivation theory and the uses and gratifications theory, which have been replicated in numerous studies and have become robust and reliable explanations of media effects and audience behavior. By striving for replicability, media students can help to establish a foundation of knowledge that can be built upon by future research and contribute to a deeper understanding of the role of media in society.
Reliability is an essential aspect of research, especially in the field of media studies. It refers to the consistency and dependability of research findings, which should be replicable over time and across different contexts. In other words, a reliable study should yield the same results when conducted by different researchers or at different times. Achieving reliability in research requires careful planning, methodology, and data analysis. This essay explains how media students can ensure reliability in their research and provides examples of reliable studies in the field.
To achieve reliability in research, media students need to adhere to rigorous and consistent research methods. This means that they should design their studies with clear research questions, objectives, and hypotheses, and use appropriate research designs and sampling methods to minimize bias and errors. For instance, if a media student is investigating the impact of social media on political polarization, they should use a randomized controlled trial or a longitudinal study with a representative sample to ensure that their findings are not skewed by selection bias or confounding variables.
Moreover, media students should use reliable and valid measurement tools to collect data, such as surveys, interviews, or content analysis. These tools should be tested for their reliability and validity before being used in the actual study. For example, if a media student is measuring media literacy, they should use a standardized and validated scale such as the Media Literacy Scale (MLQ) developed by Renee Hobbs, which has been shown to have high internal consistency and test-retest reliability.
Additionally, media students should analyze their data using reliable statistical methods and software, such as SPSS or R. They should also report their findings accurately and transparently, providing sufficient details about their methodology, data, and limitations. This allows other researchers to replicate their study and verify their findings, which enhances the reliability and credibility of their research.
One example of a reliable study in media studies is the research conducted by Pew Research Center on social media use in the United States. Pew Research Center has been conducting surveys on social media use since 2005, using consistent and standardized questions and methods across different surveys. This has allowed them to track changes and trends in social media use over time, and their findings have been widely cited and used by policymakers, journalists, and scholars.
Another example is the research conducted by Sonia Livingstone and Julian Sefton-Green on young people’s digital lives. They conducted a qualitative study with 28 participants from diverse backgrounds and analyzed their interviews and online activities using grounded theory. They also used member checking and peer debriefing to enhance the trustworthiness and credibility of their findings. Their study has been praised for its rich and nuanced insights into young people’s digital practices and has influenced policy and practice in education and media literacy.
In conclusion, achieving reliability in research is crucial for media students who want to produce valid and trustworthy findings. They should plan their studies carefully, use reliable methods and measurement tools, analyze their data accurately, and report their findings transparently. By doing so, they can contribute to the advancement of knowledge in media studies and inform policy and practice in the field.
APA 7 style is a comprehensive formatting and citation system widely used in academic and professional writing. This essay will cover key aspects of APA 7, including in-text referencing, reference list formatting, and reporting statistical results, tables, and figures.
In-Text Referencing
In-text citations in APA 7 style provide brief information about the source directly in the text. The basic format includes the author’s last name and the year of publication. For example:
One author: (Smith, 2020)
Two authors: (Smith & Jones, 2020)
Three or more authors: (Smith et al., 2020)
When quoting directly, include the page number: (Smith, 2020, p. 25).
Reference List
The reference list appears at the end of the paper on a new page. Key formatting rules include:
Double-space all entries
Use a hanging indent for each entry
Alphabetize entries by the first author’s last name
Example reference list entry for a journal article:
Smith, J. D., & Jones, A. B. (2020). Title of the article. Journal Name, 34, 123-145. https://doi.org/10.1234/example
Reporting Statistical Results
When reporting statistical results in APA 7 style:
Use italics for statistical symbols (e.g., M, SD, t, F, p)
Report exact p values to two or three decimal places
Use APA-approved abbreviations for statistical terms
Example: The results were statistically significant (t(34) = 2.45, p = .019).
Even though most student plagiarism is probably unintentional, it is in students’ best interests to become aware that failing to give credit where it is due can have serious consequences. For example, at Butte College, a student caught in even one act of academic dishonesty may face one or more of the following actions by his instructor or the college:
Receive a failing grade on the assignment
Receive a failing grade in the course
Receive a formal reprimand
Be suspended
Be expelled
My paraphrasing is plagiarized? Of course, phrases used unchanged from the source should appear in quotation marks with a citation. But even paraphrasing must be attributed to the source whence it came, since it represents the ideas and conclusions of another person. Furthermore, your paraphrasing should address not only the words but the form, or structure, of the statement. The example that follows rewords (uses synonyms) but does not restructure the original statement:
Original: To study the challenge of increasing the food supply, reducing pollution, and encouraging economic growth, geographers must ask where and why a region’s population is distributed as it is. Therefore, our study of human geography begins with a study of population (Rubenstein 37).
Inadequately paraphrased (word substitution only) and uncited: To increase food supplies, ensure cleaner air and water, and promote a strong economy, researchers must understand where in a region people choose to live and why. So human geography researchers start by studying populations.
This writer reworded a two-sentence quote. That makes it his, right? Wrong. Word substitution does not make a sentence, much less an idea, yours. Even if it were attributed to the author, this rewording is not enough; paraphrasing requires that you change the sentence structure as well as the words. Either quote the passage directly, or substantially change the original by incorporating the idea the sentences represent into your own claim:
Adequately, substantially paraphrased and cited: As Rubenstein points out, distribution studies like the ones mentioned above are at the heart of human geography; they are an essential first step in planning and controlling development (37).
Perhaps the best way to avoid the error of inadequate paraphrasing is to know clearly what your own thesis is. Then, before using any source, ask yourself, “Does this idea support my thesis? How?” This, after all, is the only reason to use any material in your paper. If your thesis is unclear in your own mind, you are more likely to lean too heavily on the statements and ideas of others. However, the ideas you find in your sources may not replace your own well thought-out thesis.
Copy & paste is plagiarism? Copy & paste plagiarism occurs when a student selects and copies material from Internet sources and then pastes it directly into a draft paper without proper attribution. Copy & paste plagiarism may be partly a result of middle school and high school instruction that is unclear or lax about plagiarism issues. In technology-rich U.S. classrooms, students are routinely taught how to copy & paste their research from Internet sources into word processing documents. Unfortunately, instruction and follow-up in how to properly attribute this borrowed material tends to be sparse. The fact is, pictures and text (like music files) posted on the Internet are the intellectual property of their creators. If the authors make their material available for your use, you must give them credit for creating it. If you do not, you are stealing.
How will my instructor know? If you imagine your instructor will not know that you have plagiarized, imagine it at your own risk. Some schools subscribe to anti-plagiarism sites that compare submitted papers to vast online databases very quickly and return search results listing “hits” on phrases found to be unoriginal. Some instructors use other methods of searching online for suspicious phrases in order to locate source material for work they suspect may be plagiarized.
College instructors read hundreds of pages of published works every year. They know what is being written about their subject areas. At the same time, they read hundreds of pages of student-written papers. They know what student writing looks like. Writers, student or otherwise, do not usually stray far from their typical vocabulary and sentence structure, so if an instructor finds a phrase in your paper that does not “read” like the rest of the paper, he or she may become suspicious.
Why cite? If you need reasons to cite beyond the mere avoidance of disciplinary consequences, consider the following:
Citing is honest. It is the right thing to do.
Citing allows a reader interested in your topic to follow up by accessing your sources and reading more. (Hey, it could happen!)
Citing shows off your research expertise-how deeply you read, how long you spent in the library stacks, how many different kinds of sources (books, journals, databases, and websites) you waded through.
How can I avoid plagiarism? From the earliest stages of research, cultivate work habits that make accidental or lazy plagiarism less likely:
Be ready to take notes while you research. Distinguish between direct quotes and your own summaries. For example, use quotation marks or a different color pen for direct quotes, so you don’t have to guess later whether the words were yours or another author’s. For every source you read, note the author, title, and publication information before you start taking notes. This way you will not be tempted to gloss over a citation just because it is difficult to retrace your steps.
If you are reading an online source, write down the complete Internet address of the page you are reading right away (before you lose the page) so that you can go back later for bibliographic information. Look at the address carefully; you may have followed links off the website you originally accessed and be on an entirely different site. Many online documents posted on websites (rather than in online journals, for example) are not clearly attributed to an author in a byline. However, even if a website does not name the author in a conspicuous place, it may do so elsewhere–at the very bottom/end of the document, for example, or in another place on the website. Try clicking About Us to find the author. (At any rate, you should look in About Us for information about the site’s sponsor, which you need to include in Works Cited. The site sponsor may be the only author you find; you will cite it as an “institutional” author.) Even an anonymous Web source needs attribution to the website sponsor.
Of course, instead of writing the above notes longhand you could copy & paste into a “Notes” document for later use; just make sure you copy & paste the address and attribution information, too, and not directly into your research paper
Try searching online for excerpts of your own writing. Search using quotation marks around some of your key sentences or phrases; the search engine will search for the exact phrase rather than all the individual words in the phrase. If you get “hits” suggesting plagiarism, even unintentional plagiarism, follow the links to the source material so that you can properly attribute these words or ideas to their authors.
Early in the semester, ask your instructors to discuss plagiarism and their policies regarding student plagiarism. Some instructors will allow rewrites after a first offense, for example, though many will not. And most instructors will report even a first offense to the appropriate dean.
Be aware of the boundary between your own ideas and the ideas of other people. Do your own thinking. Make your own connections. Reach your own conclusions. There really is no substitute for this process. No one else but you can bring your particular background and experience to bear on a topic, and your paper should reflect that.
Works Cited Rubenstein, James M. The Cultural Landscape: An Introduction to Human Geography. Upper Saddle River, NJ: Pearson Education. 2003.
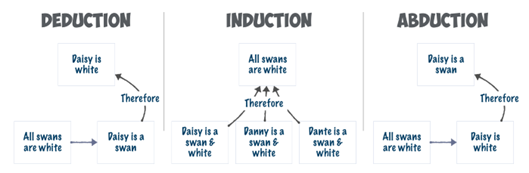
As a media student, you are likely to come across two primary research methods: inductive and deductive research. Both approaches are important in the field of media research and have their own unique advantages and disadvantages. In this essay, we will explore these two methods of research, along with some examples to help you understand the differences between the two.
Inductive research is a type of research that involves starting with specific observations or data and then moving to broader generalizations and theories (Theories, Models and Concepts) It is a bottom-up approach to research that focuses on identifying patterns and themes in the data to draw conclusions. Inductive research is useful when the research problem is new, and there is no existing theoretical framework to guide the study. This method is commonly used in qualitative research methods like ethnography, case studies, and grounded theory.
An example of inductive research in media studies would be a study of how social media has changed the way people interact with news. The researcher would start by collecting data from social media platforms and observing how people engage with news content. From this data, the researcher could identify patterns and themes, such as the rise of fake news or the tendency for people to rely on social media as their primary news source. Based on these observations, the researcher could then develop a theory about how social media has transformed the way people consume and interact with news.
On the other hand, deductive research involves starting with a theory or hypothesis (Developing a Hypothesis: A Guide for Researchers) and then testing it through observations and data. It is a top-down approach to research that begins with a general theory and seeks to prove or disprove it through empirical evidence. Deductive research is useful when there is an existing theory or hypothesis to guide the study. This method is commonly used in quantitative research methods like surveys and experiments.
An example of deductive research in media studies would be a study of the impact of violent media on aggression. The researcher would start with a theory that exposure to violent media leads to an increase in aggressive behavior. The researcher would then test this theory through observations, such as measuring the aggression of participants who have been exposed to violent media versus those who have not. Based on the results of the study, the researcher could either confirm or reject the theory.
Both inductive and deductive research are important in the field of media studies. Inductive research is useful when there is no existing theoretical framework, and the research problem is new. Deductive research is useful when there is an existing theory or hypothesis to guide the study. By understanding the differences between these two methods of research and their applications, you can choose the most appropriate research method for your media research project.
In-text citations: In-text citations are used to give credit to the original author(s) of a source within the body of your writing. In media studies, in-text citations may include the name of the author, the title of the article or book, and the date of publication. For example:
According to Jenkins (2006), “convergence culture represents a shift in the relations between media and culture, as consumers take control of the flow of media” (p. 2).
In her book The Presentation of Self in Everyday Life, Goffman (1959) discusses the ways in which individuals present themselves to others in social interactions.
Direct quotations: Direct quotations are used to include the exact words from a source within your writing, usually to provide evidence or support for a particular argument or idea. In media studies, direct quotations may be enclosed in quotation marks and followed by an in-text citation that includes the author’s last name and the date of publication. For example:
As Jenkins (2006) argues, “convergence represents a cultural shift as consumers are encouraged to seek out new information and make connections among dispersed media content” (p. 3).
In their article “The Future of Media Literacy in a Digital Age,” Hobbs and Jensen (2009) assert that “media literacy education must evolve to keep pace with changing technologies and new media practices” (p. 22).
Paraphrasing: Paraphrasing involves restating information from a source in your own words, while still giving credit to the original author(s). In media studies, paraphrased information should be followed by an in-text citation that includes the author’s last name and the date of publication. For example:
Jenkins (2006) argues that convergence culture is characterized by a shift in power from media producers to consumers, as individuals take an active role in creating and sharing content.
According to Hobbs and Jensen (2009), media literacy education needs to adapt to keep up with changing media practices and new technologies.
Secondary sources: In some cases, you may want to cite a source that you have not read directly, but have found through another source. In media studies, you should always try to locate and cite the original source, but if this is not possible, you can use the phrase “as cited in” before the secondary source. For example:
In her analysis of gender and media representation, Smith (2007) argues that women are often portrayed in stereotypical and limiting roles (as cited in Jones, 2010).
When writing in media studies, there are different citation methods you can use to give credit to the original author(s) and provide evidence to support your arguments. In-text citations, direct quotations, paraphrasing, and secondary sources can all be effective ways to incorporate citations into your writing. Remember to use citations appropriately and sparingly, and always consult the specific citation guidelines for your chosen citation style.
In media studies, it is important to choose the appropriate measurement tools to gather data on attitudes, perceptions, brain activity, and arousal. Here are some potential measurement tools that can be used to gather data in each of these areas:
Attitude:
Likert scales: This is a commonly used tool to measure attitudes. Participants are presented with a statement and asked to rate how much they agree or disagree with the statement on a scale.
Semantic differential scales: These scales ask participants to rate an object or concept using bipolar adjectives, such as “good-bad,” “happy-sad,” or “friendly-hostile.” The ratings can be used to determine participants’ attitudes toward the object or concept.
Implicit Association Test (IAT): This test measures the strength of automatic associations between mental representations of objects in memory. IAT has been widely used to assess implicit attitudes that are hard to capture with explicit self-report measures.
Perception:
Eye tracking: This measurement tool tracks the movement of participants’ eyes as they view media content. Eye tracking can provide data on where participants are looking, how long they are looking, and how quickly they are moving their eyes. This can be used to gather data on how participants perceive media content.
Psychophysics: Psychophysics can be used to measure perceptual thresholds and sensitivity to stimuli. For example, researchers can use psychophysical measurements to determine the minimum amount of stimulation necessary to detect a change in media content.
Reaction time: Reaction time can be used to measure how quickly participants respond to stimuli, such as images or sounds. Reaction time can be used to gather data on how participants perceive and react to media content.
Brain activity:
Electroencephalography (EEG): This is a non-invasive measurement tool that records the electrical activity of the brain. EEG can provide data on how the brain responds to media content and can be used to identify specific brain activity associated with certain perceptions or attitudes.
Functional Magnetic Resonance Imaging (fMRI): This is an imaging technique that measures changes in blood flow in the brain in response to specific stimuli. fMRI can provide data on how different regions of the brain respond to media content and can be used to identify the neural correlates of perceptions and attitudes.
Near-infrared spectroscopy (NIRS): This is a non-invasive measurement tool that measures changes in blood flow in the brain similar to fMRI, but uses near-infrared light rather than magnets. NIRS can provide data on the neural activity associated with perceptions and attitudes.
Arousal:
Skin conductance response (SCR): This is a measurement tool that measures changes in the electrical conductance of the skin in response to emotional stimuli. SCR can be used to gather data on the arousal levels of participants in response to media content.
Heart rate variability (HRV): This measurement tool measures the variation in time between heartbeats. HRV can be used to gather data on participants’ arousal levels and emotional state in response to media content.
Galvanic skin response (GSR): This is a measurement tool that measures changes in the electrical conductance of the skin in response to emotional stimuli, similar to SCR. GSR can be used to gather data on participants’ arousal levels in response to media content.
In conclusion, there are a variety of potential measurement tools that can be used in media studies experiments to gather data on attitudes, perceptions, brain activity, and arousal. The choice of measurement tool will depend on the specific research question and the variables being studied. Researchers should carefully consider the strengths and limitations of each measurement tool and choose the most appropriate tool for their study.
There’s something you should know: Your college instructors have a hidden agenda. You may be alarmed to hear this-yet your achievement of their “other” purpose may very well be the most important part of your education. For every writing assignment has, at the least, these two other purposes:
To teach you to state your case and prove it in a clear, appropriate, and lively manner
To teach you to structure your thinking.
Consequently, all expository writing, in which you formulate a thesis and attempt to prove it, is an opportunity to practice rigorous.
This TIP Sheet is designed to assist media students in the early stages of writing any kind of non-fiction or to start a research report/proposal piece. It outlines the following steps:
Choosing a Subject
Suppose your instructor asks you to write an essay about the role of social media in society.
Within this general subject area, you choose a subject that holds your interest and about which you can readily get information: the impact of social media on mental health.
Limiting Your Subject
What will you name your topic? Clearly, “social media” is too broad; social media encompasses various platforms, uses, and audiences, and this could very well fill a book and require extensive research. Simply calling your subject “mental health” would be misleading. You decide to limit the subject to “the effects of social media on mental health.” After some thought, you decide that a better, more specific subject might be “the relationship between social media use and depression among college students.” (Be aware that this is not the title of your essay. You will title it much later.) You have now limited your subject and are ready to craft a thesis.
Crafting a thesis statement
While your subject may be a noun phrase such as the one above, your thesis must be a complete sentence that declares where you stand on the subject. A thesis statement should almost always be in the form of a declarative sentence. Suppose you believe that social media use is linked to depression among college students; your thesis statement may be, “Excessive use of social media among college students is associated with higher levels of depression and anxiety.” Or, conversely, perhaps you think that social media use has a positive effect on mental health among college students. Your thesis might be, “Regular use of social media among college students can have a positive impact on their mental health, as it allows them to connect with peers and access mental health resources.”
Identifying supporting arguments
Now you must gather material, or find arguments to support your thesis statement. Use these questions to guide your brainstorming, and write down all ideas that come to mind:
Definition: What is social media? What is depression? How are they related? Comparison/Similarity: How does social media use by college students compare to use by other age groups? How does the rate of depression among college students compare to that of other age groups? How do the effects of social media use on mental health compare among different social media platforms? Comparison/Dissimilarity: How does social media use among college students differ from use by other age groups? How does the rate of depression among college students differ from that of other age groups? How do the effects of social media use on mental health differ among different social media platforms? Comparison/Degree: To what degree is social media use linked to depression among college students? To what degree do different social media platforms impact mental health differently? Relationship (cause and effect): What causes depression among college students? What are the effects of excessive social media use on mental health? How does social media use affect socialization among college students? Circumstance: What are the circumstances that lead college students to excessive social media use? What are the implications of limiting social media use among college students? How can college students use social media in a healthy way? Testimony: What are the opinions of mental health professionals about the effects of social media use on mental health? What are the opinions of college students who have experienced depression? What are the opinions of college students who use social media frequently and those who use it minimally? The Good: Would limiting social media use among college students be beneficial for their mental health? Would increased social media use lead to better mental health outcomes? What is fair to college students and their access to social media?
Revising Your Thesis
After you have gathered your supporting arguments, it’s time to revise your thesis statement. As you revise your thesis, ask yourself the following questionsHave I taken a clear position on the subject? Is my thesis statement specific enough? Does my thesis statement adequately capture the direction of my paper? Does my thesis statement make sense? Does my thesis statement need further revision?
Writing Strong Topic Sentences
That Support the Thesis Once you have a strong thesis statement, it’s important to make sure that each paragraph in your paper supports that thesis. The topic sentence of each paragraph should be closely related to the thesis statement and should provide a clear indication of the paragraph’s content. By carefully crafting your topic sentences, you can ensure that your paper is cohesive and focused. This TIP Sheet has provided an overview of the steps involved in crafting a strong thesis statement and supporting arguments for non-fiction writing. As a media student, you can apply these steps to any number of topics related to media studies, such as the impact of social media on political discourse, the representation of women in film, or the ethics of digital media manipulation. By carefully selecting a subject, limiting that subject, crafting a clear thesis statement, identifying supporting arguments, revising that thesis, and writing strong topic sentences that support your thesis, you can ensure that your writing is both focused and persuasive
As a student, you may be required to conduct research for a project, paper, or presentation. Research is a vital skill that can help you understand a topic more deeply, develop critical thinking skills, and support your arguments with evidence. Here are some basics of research that every student should know.
What is research?
Research is the systematic investigation of a topic to establish facts, draw conclusions, or expand knowledge. It involves collecting and analyzing information from a variety of sources to gain a deeper understanding of a subject.
Types of research
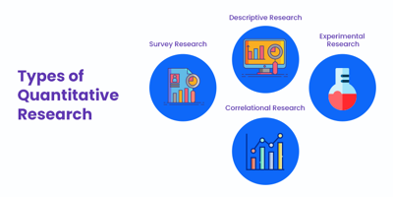
There are several types of research methods that you can use. Here are the three most common types:
1. Quantitative research involves collecting numerical data and analyzing it using statistical methods. This type of research is often used to test hypotheses or measure the effects of specific interventions or treatments.
2. Qualitative research involves collecting non-numerical data, such as observations, interviews, or open-ended survey responses. This type of research is often used to explore complex social or psychological phenomena and to gain an in-depth understanding of a topic.
3. Mixed methods research involves using both quantitative and qualitative methods to answer research questions. This type of research can provide a more comprehensive understanding of a topic by combining the strengths of both quantitative and qualitative data.
Steps of research
Research typically involves the following steps:
Choose a topic: Select a topic that interests you and is appropriate for your assignment or project.
Develop a research question: Identify a question that you want to answer through your research.
Select a research method: Choose a research method that is appropriate for your research question and topic.
Collect data: Collect information using the chosen research method. This may involve conducting surveys, interviews, experiments, or observations, or collecting data from secondary sources such as books, articles, government reports, or academic journals.
Analyze data: Examine your research data to draw conclusions and develop your argume
Present findings: Share your research and conclusions with others through a paper, presentation, or other format.
Tips for successful research
Here are some tips to help you conduct successful research:
Start early: Research can be time-consuming, so give yourself plenty of time to complete your project.
Use multiple sources: Draw information from a variety of sources to get a comprehensive understanding of your topic.
Evaluate sources: Use critical thinking skills to evaluate the accuracy, reliability, and relevance of your sources.
Take notes: Keep track of your sources and take notes on key information as you conduct research.
Organize your research: Develop an outline or organizational structure to help you keep track of your research and stay on track.
Use AI to brainstorm, get a broader insight in your topic, and what possible gaps of problems might be. Use it not to execute and completely write your final work
Theories, Models, and Concepts in Media and Marketing
In the realm of media and marketing, understanding theories, models, and concepts is crucial for developing effective strategies. These constructs provide a framework for analyzing consumer behavior, crafting strategies, and implementing marketing campaigns. This essay will explore each construct with examples to illustrate their application.
Theories
Definition: Theories in marketing and media are systematic explanations of phenomena that predict how certain variables interact. They help marketers understand consumer behavior and the effectiveness of different strategies.
Example: Maslow’s Hierarchy of Needs
Theory: Maslow’s Hierarchy of Needs is a psychological theory that suggests human actions are motivated by a progression of needs, from basic physiological requirements to self-actualization[3].
Model: In marketing, this theory is modeled by identifying which level of need a product or service satisfies. For example, a luxury car brand might focus on self-esteem needs by promoting exclusivity and status.
Concept: The concept derived from this model is “status marketing,” where products are marketed as symbols of success and achievement to appeal to consumers seeking self-esteem fulfillment.
Models
Definition: Models are simplified representations of reality that help marketers visualize complex processes and make predictions. They often serve as tools for strategic planning.
Example: AIDA Model
Theory: The AIDA model is based on the theory that consumers go through four stages before making a purchase: Attention, Interest, Desire, and Action[2].
Model: This model guides marketers in structuring their advertising campaigns to first capture attention with striking visuals or headlines, then build interest with engaging content, create desire by highlighting benefits, and finally prompt action with clear calls to action.
Concept: The concept here is “customer journey mapping,” where marketers design each stage of interaction to lead the consumer smoothly from awareness to purchase.
Concepts
Definition: Concepts are ideas or mental constructs that arise from theories and models. They provide actionable insights or strategies for marketers.
Example: Content Marketing
Theory: Content marketing is grounded in the theory that providing valuable content builds brand awareness and trust among consumers[2].
Model: A content marketing model involves creating a mix of informative blogs, engaging videos, and interactive social media posts to attract and retain an audience.
Concept: The concept derived from this model is “brand storytelling,” where brands use narratives to connect emotionally with their audience, fostering loyalty and engagement.
In the realm of media and marketing, understanding theories, models, and concepts is crucial for developing effective strategies. These constructs provide a framework for analyzing consumer behavior, crafting strategies, and implementing marketing campaigns. This essay will explore each construct with examples to illustrate their application.
Presenting research results effectively is crucial for communicating findings, influencing decision-making, and advancing knowledge across various domains. The approach to presenting these results can vary significantly depending on the setting, audience, and purpose. This essay will explore the nuances of presenting research results in different contexts, including presentations, articles, dissertations, and business reports.
Presentations
Research presentations are dynamic and interactive ways to share findings with an audience. They come in various formats, each suited to different contexts and objectives.
Oral Presentations
Oral presentations are common in academic conferences, seminars, and professional meetings. These typically involve a speaker delivering their findings to an audience, often supported by visual aids such as slides. The key to an effective oral presentation is clarity, conciseness, and engagement[1].
When preparing an oral presentation:
Structure your content logically, starting with an introduction that outlines your research question and its significance.
Present your methodology and findings clearly, using visuals to illustrate complex data.
Conclude with a summary of key points and implications of your research.
Prepare for a Q&A session, anticipating potential questions from the audience.
Poster Presentations
Poster presentations are popular at academic conferences, allowing researchers to present their work visually and engage in one-on-one discussions with interested attendees. A well-designed poster should be visually appealing and convey the essence of the research at a glance[1].
Tips for effective poster presentations:
Use a clear, logical layout with distinct sections (introduction, methods, results, conclusions).
Incorporate eye-catching visuals such as graphs, charts, and images.
Keep text concise and use bullet points where appropriate.
Be prepared to give a brief oral summary to viewers.
Online/Webinar Presentations
With the rise of remote work and virtual conferences, online presentations have become increasingly common. These presentations require additional considerations:
Ensure your audio and video quality are optimal.
Use engaging visuals to maintain audience attention.
Incorporate interactive elements like polls or Q&A sessions to boost engagement.
Practice your delivery to account for the lack of in-person cues.
Articles
Research articles are the backbone of academic publishing, providing a detailed account of research methodologies, findings, and implications. They typically follow a structured format:
Abstract: A concise summary of the research.
Introduction: Background information and research objectives.
Methodology: Detailed description of research methods.
Results: Presentation of findings, often including statistical analyses.
Discussion: Interpretation of results and their implications.
Conclusion: Summary of key findings and future research directions.
When writing a research article:
Adhere to the specific guidelines of the target journal.
Use clear, precise language and avoid jargon where possible.
Support your claims with evidence and proper citations.
Use tables and figures to present complex data effectively.
Dissertations
A dissertation is an extensive research document typically required for doctoral degrees. It presents original research and demonstrates the author’s expertise in their field. Dissertations are comprehensive and follow a structured format:
Abstract
Introduction
Literature Review
Methodology
Results
Discussion
Conclusion
References
Appendices
Key considerations for writing a dissertation:
Develop a clear research question or hypothesis.
Conduct a thorough literature review to contextualize your research.
Provide a detailed account of your methodology to ensure replicability.
Present your results comprehensively, using appropriate statistical analyses.
Discuss the implications of your findings in the context of existing literature.
Acknowledge limitations and suggest directions for future research.
Business Reports
Business reports present research findings in a format tailored to organizational decision-makers. They focus on practical implications and actionable insights. A typical business report structure includes:
Executive Summary
Introduction
Methodology
Findings
Conclusions and Recommendations
Appendices
When preparing a business report:
Begin with a concise executive summary highlighting key findings and recommendations.
Use clear, jargon-free language accessible to non-expert readers.
Incorporate visuals such as charts, graphs, and infographics to illustrate key points.
Focus on the practical implications of your findings for the organization.
Provide clear, actionable recommendations based on your research.
Focus groups are a valuable qualitative research method that can provide rich insights into people’s thoughts, feelings, and experiences on a particular topic. As a university student, conducting focus groups can be an excellent way to gather data for research projects or to gain a deeper understanding of student perspectives on various issues.
Planning and Preparation
Defining Objectives
Before conducting a focus group, it’s crucial to clearly define your research objectives. Ask yourself:
What specific information do you want to gather?
How will this data contribute to your research or project goals?
Are focus groups the most appropriate method for obtaining this information?
Having well-defined objectives will guide your question development and ensure that the focus group yields relevant and useful data[4].
Participant Selection
Carefully consider who should participate in your focus group. For student-focused research, you may want to target specific groups such as:
Students from a particular major or year of study
Those involved in certain campus activities or programs
Students with specific experiences (e.g., study abroad participants)
Aim for 6-10 participants per group to encourage dynamic discussion while still allowing everyone to contribute[3].
Logistics and Scheduling
When organizing focus groups with university students, consider the following:
Schedule sessions during convenient times, such as weekday evenings or around meal times
Avoid weekends or busy periods during the academic calendar
Choose a comfortable, easily accessible location on campus
Provide incentives such as food, gift cards, or extra credit (if approved by your institution)[4]
Conducting the Focus Group
Setting the Stage
Begin your focus group by:
Welcoming participants and explaining the purpose of the session
Obtaining informed consent, emphasizing voluntary participation and confidentiality
Establishing ground rules for respectful discussion[3]
Facilitation Techniques
As a student facilitator, consider these strategies:
Use open-ended questions to encourage detailed responses
Employ probing techniques to delve deeper into participants’ thoughts
Ensure all participants have an opportunity to speak
Remain neutral and avoid leading questions or expressing personal opinions
Use active listening skills and paraphrase responses to confirm understanding[3][4]
Data Collection
To capture the rich data from your focus group:
Take detailed notes or consider audio recording the session (with participants’ permission)
Pay attention to non-verbal cues and group dynamics
Use a co-facilitator to assist with note-taking and managing the session[3]
Analysis and Reporting
After conducting your focus group:
Transcribe the session if it was recorded
Review notes and transcripts to identify key themes and patterns
Organize findings according to your research objectives
Consider using qualitative data analysis software for more complex projects
Prepare a report summarizing your findings and their implications
Challenges and Considerations
As a student researcher, be aware of potential challenges:
Peer pressure influencing responses
Maintaining participant engagement throughout the session
Managing dominant personalities within the group
Ensuring confidentiality, especially when discussing sensitive topics
Balancing your role as a peer and a researcher[4]
Conclusion
Conducting focus groups as a university student can be a rewarding and insightful experience. By carefully planning, skillfully facilitating, and thoughtfully analyzing the data, you can gather valuable information to support your research objectives. Remember that practice and reflection will help you improve your focus group facilitation skills over time.
Here is a guide on how to conduct a thematic analysis:
What is Thematic Analysis?
Thematic analysis is a qualitative research method used to identify, analyze, and report patterns or themes within data. It allows you to systematically examine a set of texts, such as interview transcripts, and extract meaningful themes that address your research question.
Steps for Conducting a Thematic Analysis
1. Familiarize yourself with the data
Immerse yourself in the data by reading and re-reading the texts. Take initial notes on potential themes or patterns you notice.
2. Generate initial codes
Go through the data and code interesting features in a systematic way. Codes identify a feature of the data that appears interesting to the analyst. Some examples of codes could be:
“Feelings of anxiety”
“Financial stress”
“Family support”
3. Search for themes
Sort the different codes into potential themes. Look for broader patterns across the codes and group related codes together. At this stage, you may have a collection of candidate themes and sub-themes.
4. Review themes
Refine your candidate themes. Some themes may collapse into each other, while others may need to be broken down into separate themes. Check if the themes work in relation to the coded extracts and the entire data set.
5. Define and name themes
Identify the essence of what each theme is about and determine what aspect of the data each theme captures. Come up with clear definitions and names for each theme.
6. Produce the report
Select vivid, compelling extract examples, relate back to the research question and literature, and produce a scholarly report of the analysis.
Tips for Effective Thematic Analysis
Be thorough and systematic in working through the entire data set
Ensure your themes are distinct but related
Use quotes from the data to support your themes
Look for both similarities and differences across the data set
Consider how themes relate to each other
Avoid simply paraphrasing the content – interpret the data
Example
Let’s say you were analyzing interview data about people’s experiences with online dating. Some potential themes that could emerge:
Feelings of anxiety and vulnerability
Importance of authenticity
Challenges of self-presentation
Impact on self-esteem
Changing nature of relationships
For each theme, you would provide supporting quotes from the interviews and explain how they illustrate that theme.
By following these steps and tips, you can conduct a rigorous thematic analysis that provides meaningful insights into your data. The key is to be systematic, thorough, and reflective throughout the process.
Measures of central tendency are statistical values that aim to describe the center or typical value of a dataset. The three most common measures are mean, median, and mode.
Mean
The arithmetic mean, often simply called the average, is calculated by summing all values in a dataset and dividing by the number of values. It is the most widely used measure of central tendency.
For a dataset $$x_1, x_2, …, x_n$$, the mean ($$\bar{x}$$) is given by:
$$\bar{x} = \frac{\sum_{i=1}^n x_i}{n}$$
The mean is sensitive to extreme values or outliers, which can significantly affect its value.
Median
The median is the middle value when a dataset is ordered from least to greatest. For an odd number of values, it’s the middle number. For an even number of values, it’s the average of the two middle numbers.
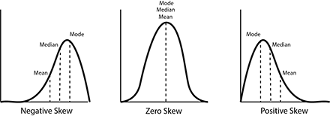
The median is less sensitive to extreme values compared to the mean, making it a better measure of central tendency for skewed distributions[1].
Mode
The mode is the value that appears most frequently in a dataset. A dataset can have one mode (unimodal), two modes (bimodal), or more (multimodal). Some datasets may have no mode if all values occur with equal frequency [1].
Measures of Dispersion
Measures of dispersion describe the spread or variability of a dataset around its central tendency.
Range
The range is the simplest measure of dispersion, calculated as the difference between the largest and smallest values in a dataset [3]. While easy to calculate, it’s sensitive to outliers and doesn’t use all observations in the dataset.
Variance
Variance measures the average squared deviation from the mean. For a sample, it’s calculated as:
Where $$s^2$$ is the sample variance, $$x_i$$ are individual values, $$\bar{x}$$ is the mean, and $$n$$ is the sample size[2].
Standard Deviation
The standard deviation is the square root of the variance. It’s the most commonly used measure of dispersion as it’s in the same units as the original data [3]. For a sample:
In a normal distribution, approximately 68% of the data falls within one standard deviation of the mean, 95% within two standard deviations, and 99.7% within three standard deviations [3].
Quartiles and Percentiles
Quartiles divide an ordered dataset into four equal parts. The first quartile (Q1) is the 25th percentile, the second quartile (Q2) is the median or 50th percentile, and the third quartile (Q3) is the 75th percentile [4].
The interquartile range (IQR), calculated as Q3 – Q1, is a robust measure of dispersion that describes the middle 50% of the data [3].
Percentiles generalize this concept, dividing the data into 100 equal parts. The pth percentile is the value below which p% of the observations fall [4].
Howitt and Cramer Chapter 2 and 3 Variables, concepts, and models form the foundation of scientific research, providing researchers with the tools to investigate complex phenomena and draw meaningful conclusions. This essay will explore these elements and their interrelationships, as well as discuss levels of measurement and the role of statistics in research.
Concepts and Variables in Research
Research begins with concepts – abstract ideas or phenomena that researchers aim to study. These concepts are often broad and require further refinement to be measurable in a scientific context[5]. For example, “educational achievement” is a concept that encompasses various aspects of a student’s performance and growth in an academic setting.
To make these abstract concepts tangible and measurable, researchers operationalize them into variables. Variables are specific, measurable properties or characteristics of the concept under study. In the case of educational achievement, variables might include “performance at school” or “standardized test scores.”
Types of Variables
Research typically involves several types of variables:
Independent Variables: These are the factors manipulated or controlled by the researcher to observe their effects on other variables. For instance, in a study on the impact of teaching methods on student performance, the teaching method would be the independent variable.
Dependent Variables: These are the outcomes or effects that researchers aim to measure and understand. In the previous example, student performance would be the dependent variable, as it is expected to change in response to different teaching methods.
Moderating Variables: These variables influence the strength or direction of the relationship between independent and dependent variables. For example, a student’s motivation level might moderate the effect of study time on exam performance.
Mediating Variables: These variables help explain the mechanism through which an independent variable influences a dependent variable. For instance, increased focus might mediate the relationship between coffee consumption and exam performance.
Control Variables: These are factors held constant to ensure they don’t impact the relationships being studied.
Conceptual Models in Research
A conceptual model is a visual representation of the relationships between variables in a study. It serves as a roadmap for the research, illustrating the hypothesized connections between independent, dependent, moderating, and mediating variables.
Conceptual models are particularly useful in testing research or studies examining relationships between variables. They help researchers clarify their hypotheses and guide the design of their studies.
Levels of Measurement
When operationalizing concepts into variables, researchers must consider the level of measurement. There are four primary levels of measurement:
Nominal: Categories without inherent order (e.g., gender, ethnicity).
Ordinal: Categories with a meaningful order but no consistent interval between levels (e.g., education level).
Interval: Numeric scales with consistent intervals but no true zero point (e.g., temperature in Celsius).
Ratio: Numeric scales with consistent intervals and a true zero point (e.g., age, weight).
Understanding the level of measurement is crucial as it determines the types of statistical analyses that can be appropriately applied to the data.
The Goal and Function of Statistics in Research
Statistics play a vital role in research, serving several key functions:
Data Summary: Statistics provide methods to condense large datasets into meaningful summaries, allowing researchers to identify patterns and trends.
Hypothesis Testing: Statistical tests enable researchers to determine whether observed effects are likely to be genuine or merely due to chance.
Estimation: Statistics allow researchers to make inferences about populations based on sample data.
Prediction: Statistical models can be used to forecast future outcomes based on current data.
Relationship Exploration: Techniques like correlation and regression analysis help researchers understand the relationships between variables.
The overarching goal of statistics in research is to provide a rigorous, quantitative framework for drawing conclusions from data. This framework helps ensure that research findings are reliable, reproducible, and generalizable.
Probability distributions are fundamental concepts in statistics that describe how data is spread out or distributed. Understanding these distributions is crucial for students in fields ranging from social sciences to engineering. This essay will explore several key types of distributions and their characteristics.
Normal Distribution
The normal distribution, also known as the Gaussian distribution, is one of the most important probability distributions in statistics[1]. It is characterized by its distinctive bell-shaped curve and is symmetrical about the mean. The normal distribution has several key properties:
The mean, median, and mode are all equal.
Approximately 68% of the data falls within one standard deviation of the mean.
About 95% of the data falls within two standard deviations of the mean.
Roughly 99.7% of the data falls within three standard deviations of the mean.
The normal distribution is widely used in natural and social sciences due to its ability to model many real-world phenomena.
Skewness
Skewness is a measure of the asymmetry of a probability distribution. It indicates whether the data is skewed to the left or right of the mean[6]. There are three types of skewness:
Positive skew: The tail of the distribution extends further to the right.
Negative skew: The tail of the distribution extends further to the left.
Zero skew: The distribution is symmetrical (like the normal distribution).
Understanding skewness is important for students as it helps in interpreting data and choosing appropriate statistical methods.
Kurtosis
Kurtosis measures the “tailedness” of a probability distribution. It describes the shape of a distribution’s tails in relation to its overall shape. There are three main types of kurtosis:
Mesokurtic: Normal level of kurtosis (e.g., normal distribution).
Leptokurtic: Higher, sharper peak with heavier tails.
Platykurtic: Lower, flatter peak with lighter tails.
Kurtosis is particularly useful for students analyzing financial data or studying risk management[6].
Bimodal Distribution
A bimodal distribution is characterized by two distinct peaks or modes. This type of distribution can occur when:
The data comes from two different populations.
There are two distinct subgroups within a single population.
Bimodal distributions are often encountered in fields such as biology, sociology, and marketing. Students should be aware that the presence of bimodality may indicate the need for further investigation into underlying factors causing the two peaks[8].
Multimodal Distribution
Multimodal distributions have more than two peaks or modes. These distributions can arise from:
Data collected from multiple distinct populations.
Complex systems with multiple interacting factors.
Multimodal distributions are common in fields such as ecology, genetics, and social sciences. Students should recognize that multimodality often suggests the presence of multiple subgroups or processes within the data.
In conclusion, understanding various probability distributions is essential for students across many disciplines. By grasping concepts such as normal distribution, skewness, kurtosis, and multi-modal distributions, students can better analyze and interpret data in their respective fields of study. As they progress in their academic and professional careers, this knowledge will prove invaluable in making informed decisions based on statistical analysis.
A great online survey provides you with clear, reliable, actionable insight to inform your decision-making. Great surveys have higher response rates, higher quality data and are easy to fill out.
Follow these 10 tips to create great surveys, improve the response rate of your survey, and improve the quality of the data you gather.
10 steps to create a great survey
1. Clearly define the purpose of your online survey
For BUAS we use Qualtrics which is a web–based online survey tool packed with industry–leading features designed by noted market researchers.
Fuzzy goals lead to fuzzy results, and the last thing you want to end up with is a set of results that provide no real decision–enhancing value. Good surveys have focused objectives that are easily understood. Spend time up front to identify, in writing:
What is the goal of this survey?
Why are you creating this survey?
What do you hope to accomplish with this survey?
How will you use the data you are collecting?
What decisions do you hope to impact with the results of this survey? (This will later help you identify what data you need to collect in order to make these decisions.)
Sounds obvious, but we have seen plenty of surveys where a few minutes of planning could have made the difference between receiving quality responses (responses that are useful as inputs to decisions) or un–interpretable data.
Consider the case of the software firm that wanted to find out what new functionality was most important to customers. The survey asked ‘How can we improve our product?’ The resulting answers ranged from ‘Make it easier’ to ‘Add an update button on the recruiting page.’ While interesting information, this data is not really helpful for the product manager who wanted to make an itemized list for the development team, with customer input as a prioritization variable.
Spending time identifying the objective might have helped the survey creators determine:
Are we trying to understand our customers’ perception of our software in order to identify areas of improvement (e.g. hard to use, time consuming, unreliable)?
Are we trying to understand the value of specific enhancements? They would have been better off asking customers to please rank from 1 – 5 the importance of adding X new functionality.
Advance planning helps ensure that the survey asks the right questions to meet the objective and generate useful data.
2. Keep the survey short and focused
Short and focused helps with both quality and quantity of response. It is generally better to focus on a single objective than try to create a master survey that covers multiple objectives.
Shorter surveys generally have higher response rates and lower abandonment among survey respondents. It’s human nature to want things to be quick and easy – once a survey taker loses interest they simply abandon the task – leaving you to determine how to interpret that partial data set (or whether to use it all).
Make sure each of your questions is focused on helping to meet your stated objective. Don’t toss in ‘nice to have’ questions that don’t directly provide data to help you meet your objectives.
To be certain that the survey is short; time a few people taking the survey. SurveyMonkey research (along with Gallup and others) has shown that the survey should take 5 minutes or less to complete. 6 – 10 minutes is acceptable but we see significant abandonment rates occurring after 11 minutes.
3. Keep the questions simple
Make sure your questions get to the point and avoid the use of jargon. We on the SurveyMonkey team have often received surveys with questions along the lines of: “When was the last time you used our RGS?” (What’s RGS?) Don’t assume that your survey takers are as comfortable with your acronyms as you are.
Try to make your questions as specific and direct as possible. Compare: What has your experience been working with our HR team? To: How satisfied are you with the response time of our HR team?
4. Use closed ended questions whenever possible
Closed ended survey questions give respondents specific choices (e.g. Yes or No), making it easier to analyze results. Closed ended questions can take the form of yes/no, multiple choice or rating scale. Open ended survey questions allow people to answer a question in their own words. Open–ended questions are great supplemental questions and may provide useful qualitative information and insights. However, for collating and analysis purposes, closed ended questions are preferable.
5. Keep rating scale questions consistent through the survey
Rating scales are a great way to measure and compare sets of variables. If you elect to use rating scales (e.g. from 1 – 5) keep it consistent throughout the survey. Use the same number of points on the scale and make sure meanings of high and low stay consistent throughout the survey. Also, use an odd number in your rating scale to make data analysis easier. Switching your rating scales around will confuse survey takers, which will lead to untrustworthy responses.
6. Logical ordering
Make sure your survey flows in a logical order. Begin with a brief introduction that motivates survey takers to complete the survey (e.g. “Help us improve our service to you. Please answer the following short survey.”). Next, it is a good idea to start from broader–based questions and then move to those narrower in scope. It is usually better to collect demographic data and ask any sensitive questions at the end (unless you are using this information to screen out survey participants). If you are asking for contact information, place that information last.
7. Pre–test your survey
Make sure you pre–test your survey with a few members of your target audience and/or co–workers to find glitches and unexpected question interpretations.
8. Consider your audience when sending survey invitations
Recent statistics show the highest open and click rates take place on Monday, Friday and Sunday. In addition, our research shows that the quality of survey responses does not vary from weekday to weekend. That being said, it is most important to consider your audience. For instance, for employee surveys, you should send during the business week and at a time that is suitable for your business. i.e. if you are a sales driven business avoid sending to employees at month end when they are trying to close business.
9. Consider sending several reminders
While not appropriate for all surveys, sending out reminders to those who haven’t previously responded can often provide a significant boost in response rates.
10. Consider offering an incentive
Depending upon the type of survey and survey audience, offering an incentive is usually very effective at improving response rates. People like the idea of getting something for their time. SurveyMonkey research has shown that incentives typically boost response rates by 50% on average.
One caveat is to keep the incentive appropriate in scope. Overly large incentives can lead to undesirable behavior, for example, people lying about demographics in order to not be screened out from the survey.
Univariate analysis is a statistical method that focuses on analyzing one variable at a time. In this type of analysis, we try to understand the characteristics of a single variable by using various statistical techniques. The main objective of univariate analysis is to get a comprehensive understanding of a single variable, its distribution, and its relationship with other variables.
Measures of Central Tendency
Measures of central tendency are statistical measures that help us to determine the center of a dataset. They give us an idea of where most of the data lies and what is the average value of a dataset. There are three main measures of central tendency: mean, median, and mode.
Mean The mean, also known as the average, is calculated by adding up all the values of a dataset and then dividing the sum by the total number of values. It is represented by the symbol ‘μ’ (mu) in statistics. The mean is the most commonly used measure of central tendency.
Median The median is the middle value of a dataset when the data is arranged in ascending or descending order. If the number of values in a dataset is odd, the median is the middle value. If the number of values is even, the median is the average of the two middle values.
Mode The mode is the value that appears most frequently in a dataset. It is the most common value in a dataset. A dataset can have one mode, multiple modes, or no mode.
Measures of Dispersion
Measures of dispersion are statistical measures that help us to determine the spread of a dataset. They give us an idea of how far the values in a dataset are spread out from the central tendency. There are two main measures of dispersion: range and standard deviation.
Range The range is the difference between the largest and smallest values in a dataset. It gives us an idea of how much the values in a dataset vary.
Standard Deviation The standard deviation is a measure of how much the values in a dataset vary from the mean. It is represented by the symbol ‘σ’ (sigma) in statistics. The standard deviation is a more precise measure of dispersion than the range.
Conclusion
In conclusion, univariate analysis is a statistical method that helps us to understand the characteristics of a single variable. Measures of central tendency and measures of dispersion are two important concepts in univariate analysis that help us to determine the center and spread of a dataset. Understanding these concepts is crucial for analyzing data and making informed decisions.
Quantitative research is a type of research that uses numerical data and statistical analysis to understand and explain phenomena. It is a systematic and objective method of collecting, analyzing, and interpreting data to answer research questions and test hypotheses.
The following are some of the commonly used methods for conducting quantitative research:
Survey research: This method involves collecting data from a large number of individuals through self-administered questionnaires or interviews. Surveys can be administered in person, by mail, by phone, or online.
Experimental research: In experimental research, the researcher manipulates an independent variable to observe the effect on a dependent variable. The goal is to establish cause-and-effect relationships between variables.
Quasi-experimental research: This method is similar to experimental research, but the researcher does not have full control over the assignment of participants to groups.
Correlational research: This method involves examining the relationship between two or more variables without manipulating any of them. The goal is to identify patterns of association between variables.
Longitudinal research: This method involves collecting data from the same individuals over an extended period of time. The goal is to study changes in variables over time and understand the underlying processes.
Cross-sectional research: This method involves collecting data from different individuals at the same point in time. The goal is to study differences between groups and understand the prevalence of variables in a population.
Case study research: This method involves in-depth examination of a single individual or group. The goal is to gain a comprehensive understanding of a phenomenon.
It is important to choose the appropriate method based on the research question and the type of data being analyzed. For example, if the goal is to establish cause-and-effect relationships, an experimental design is more appropriate than a survey design.
Quantitative research is a valuable tool for understanding and explaining phenomena in a systematic and objective way. By selecting the appropriate method, researchers can collect and analyze data to answer their research questions and test hypotheses.
Bivariate analysis is a statistical technique used to examine the relationship between two variables. This type of analysis is often used in fields such as psychology, economics, and sociology to study the relationship between two variables and determine if there is a significant relationship between them.
Correlation
Correlation is a measure of the strength and direction of the relationship between two variables. A positive correlation means that as one variable increases, the other variable also increases, and vice versa. A negative correlation means that as one variable increases, the other decreases. The strength of the correlation is indicated by a correlation coefficient, which ranges from -1 to +1. A coefficient of -1 indicates a perfect negative correlation, +1 indicates a perfect positive correlation, and 0 indicates no correlation.
T-Test
A t-test is a statistical test that compares the means of two groups to determine if there is a significant difference between them. The t-test is commonly used to test the hypothesis that the means of two populations are equal. If the t-statistic is greater than the critical value, then the difference between the means is considered significant.
Chi Square Test
The chi square test is a statistical test used to determine if there is a significant association between two categorical variables. The test measures the difference between the observed frequencies and the expected frequencies in a contingency table. If the calculated chi square statistic is greater than the critical value, then the association between the two variables is considered significant.
Significance
Significance in statistical analysis refers to the likelihood that an observed relationship between two variables is not due to chance. In other words, it measures the probability that the relationship is real and not just a random occurrence. In statistical analysis, a relationship is considered significant if the p-value is less than a set alpha level, usually 0.05.
In conclusion, bivariate analysis is an important tool for understanding the relationship between two variables. Correlation, t-test, and chi square test are three commonly used methods for bivariate analysis, each with its own strengths and weaknesses. It is important to understand the underlying assumptions and limitations of each method and to choose the appropriate test based on the research question and the type of data being analyzed
A hypothesis is a statement that predicts the relationship between two or more variables. It is a crucial step in the scientific process, as it sets the direction for further investigation and helps researchers to determine whether their assumptions and predictions are supported by evidence. In this blog post, we will discuss the steps involved in developing a hypothesis and provide tips for making your hypothesis as effective as possible.
Step 1: Identify a Research Problem
The first step in developing a hypothesis is to identify a research problem. This can be done by reviewing the literature in your field, consulting with experts, or simply observing a phenomenon that you find interesting. Once you have identified a problem, you should clearly define the question you want to answer and determine the variables that may be relevant to the problem.
Step 2: Conduct a Literature Review
Once you have defined your research problem, the next step is to conduct a literature review. This will help you to understand what is already known about the topic, identify gaps in the literature, and determine what has been done and what still needs to be done. During this step, you should also identify any potential biases, limitations, or gaps in the existing research, as this will help you to refine your hypothesis and avoid making the same mistakes as previous researchers.
Step 3: Formulate a Hypothesis
With a clear understanding of the research problem and existing literature, you can now formulate a hypothesis. A well-written hypothesis should be clear, concise, and specific, and should specify the variables that you expect to be related. For example, if you are studying the relationship between exercise and weight loss, your hypothesis might be: “Regular exercise will lead to significant weight loss.”
The null hypothesis and the alternative hypothesis are two types of hypotheses that are used in statistical testing.
The null hypothesis (H0) is a statement that predicts that there is no significant relationship between the variables being studied. In other words, the null hypothesis assumes that any observed relationship between the variables is due to chance or random error. The null hypothesis is the default position and is assumed to be true unless evidence is found to reject it.
The alternative hypothesis (H1), on the other hand, is a statement that predicts that there is a significant relationship between the variables being studied. The alternative hypothesis is what the researcher is trying to prove, and is the opposite of the null hypothesis. In statistical testing, the goal is to determine whether there is sufficient evidence to reject the null hypothesis in favor of the alternative hypothesis.
When conducting statistical tests, researchers typically set a significance level, which is the probability of rejecting the null hypothesis when it is actually true. The most commonly used significance level is 0.05, which means that there is a 5% chance of rejecting the null hypothesis when it is actually true.
It is important to note that the null hypothesis and alternative hypothesis should be complementary and exhaustive, meaning that they should cover all possible outcomes of the study and that only one of the hypotheses can be true. The results of the statistical test will either support the null hypothesis or provide evidence to reject it in favor of the alternative hypothesis.
Step 4: Refine and Test Your Hypothesis
Once you have formulated a hypothesis, you should refine it based on your literature review and any additional information you have gathered. This may involve making changes to the variables you are studying, adjusting the methods you will use to test your hypothesis, or modifying your hypothesis to better reflect your research question.
Once your hypothesis is refined, you can then test it using a variety of methods, such as surveys, experiments, or observational studies. The results of your study should provide evidence to support or reject your hypothesis, and will inform the next steps in your research process.
Tips for Developing Effective Hypotheses:
Be Specific: Your hypothesis should clearly state the relationship between the variables you are studying, and should avoid using vague or imprecise language.
Be Realistic: Your hypothesis should be based on existing knowledge and should be feasible to test.
Avoid Confirmation Bias: Be open to the possibility that your hypothesis may be wrong, and avoid assuming that your results will support your hypothesis before you have collected and analyzed the data.
Consider Alternative Hypotheses: Be sure to consider alternative explanations for the relationship between the variables you are studying, and be prepared to revise your hypothesis if your results suggest a different relationship.
Developing a hypothesis is a critical step in the scientific process and is essential for conducting rigorous and reliable research. By following the steps outlined above, and by keeping these tips in mind, you can develop an effective and well-supported hypothesis that will guide your research and lead to new insights and discoveries
When working with datasets, it is important to understand the central tendency and dispersion of the data. These measures give us a general idea of how the data is distributed and what its typical values are. However, when the data is skewed or has outliers, it can be difficult to determine the central tendency and dispersion accurately. In this blog post, we’ll explore how to deal with skewed datasets and how to choose the appropriate measures of central tendency and dispersion.
What is a Skewed Dataset?
A skewed dataset is one in which the values are not evenly distributed. Instead, the data is skewed towards one end of the scale. There are two types of skewness: positive and negative. In a positive skewed dataset, the values are skewed to the right, while in a negative skewed dataset, the values are skewed to the left.
Measures of Central Tendency
Measures of central tendency are used to determine the typical value or center of a dataset. The three most commonly used measures of central tendency are the mean, median, and mode.
Mean: The mean is the sum of all the values in the dataset divided by the number of values. It gives us an average value for the dataset.
Median: The median is the middle value in a dataset. If the dataset has an odd number of values, the median is the value in the middle. If the dataset has an even number of values, the median is the average of the two middle values.
Mode: The mode is the value that occurs most frequently in the dataset.
In a skewed dataset, the mean is often skewed in the same direction as the data. This means that the mean may not accurately represent the typical value in a skewed dataset. In these cases, the median is often a better measure of central tendency. The median gives us the middle value in the dataset, which is not affected by outliers or skewness.
Measures of Dispersion
Measures of dispersion are used to determine how spread out the values in a dataset are. The two most commonly used measures of dispersion are the range and the standard deviation.
Range: The range is the difference between the highest and lowest values in the dataset.
Standard deviation: The standard deviation is a measure of how much the values in a dataset vary from the mean.
In a skewed dataset, the range and standard deviation may be affected by outliers or skewness. In these cases, it is important to use other measures of dispersion, such as the interquartile range or trimmed mean, to get a more accurate representation of the dispersion in the data.
When dealing with skewed datasets, it is important to choose the appropriate measures of central tendency and dispersion. The mean, median, and mode are measures of central tendency, while the range and standard deviation are measures of dispersion. In a skewed dataset, the mean may not accurately represent the typical value, and the range and standard deviation may be affected by outliers or skewness. In these cases, it is often better to use the median or other measures of dispersion to get a more accurate representation of the data.
Experimental design is a crucial aspect of media studies research, as it allows researchers to test hypotheses about media effects and gain insights into the ways that media affects individuals and society. In this blog post, we will delve into the basics of experimental design in media studies and provide examples of its application.
Step 1: Define the Research Question The first step in any experimental design is to formulate a research question. In media studies, research questions might involve the effects of media content on attitudes, behaviors, or emotions. For example, “Does exposure to violent media increase aggressive behavior in adolescents?”
Step 2: Develop a Hypothesis Once the research question has been defined, the next step is to develop a hypothesis. In media studies, hypotheses may predict the relationship between media exposure and a particular outcome. For example, “Adolescents who are exposed to violent media will exhibit higher levels of aggressive behavior compared to those who are not exposed.”
Step 3: Choose the Experimental Design There are several experimental designs to choose from in media studies, including laboratory experiments, field experiments, and natural experiments. The choice of experimental design depends on the research question and the type of data being collected. For example, a laboratory experiment might be used to test the effects of violent media on aggressive behavior, while a field experiment might be used to study the impact of media literacy programs on critical media consumption.
Step 4: Determine the Sample Size The sample size is the number of participants or subjects in the study. In media studies, sample size should be large enough to produce statistically significant results, but small enough to be manageable and cost-effective. For example, a study on the effects of violent media might include 100 adolescent participants.
Step 5: Control for Confounding Variables Confounding variables are factors that may affect the outcome of the experiment and lead to incorrect conclusions. In media studies, confounding variables might include individual differences in personality, preexisting attitudes, or exposure to other sources of violence. It is essential to control for these variables by holding them constant or randomly assigning them to different groups.
Step 6: Collect and Analyze Data The next step is to collect data and analyze it to test the hypothesis. In media studies, data might include measures of media exposure, attitudes, behaviors, or emotions. The data should be collected in a systematic and reliable manner and analyzed using statistical methods.
Step 7: Draw Conclusions Based on the results of the experiment, conclusions can be drawn about the research question. The conclusions should be based on the data collected and should be reported in a clear and concise manner. For example, if the results of a study on the effects of violent media support the hypothesis, the conclusion might be that “Exposure to violent media does increase aggressive behavior in adolescents.”
In conclusion, experimental design is a critical aspect of media studies research and is used to test hypotheses about media effects and gain insights into the ways that media affects individuals and society. By following the seven steps outlined in this blog post, media studies researchers can increase the reliability and validity of their results and contribute to our understanding of the impact of media on society.
Experiments are a fundamental part of the scientific method, allowing researchers to systematically investigate phenomena and test hypotheses. Setting up an experiment is a crucial step in the process of conducting research, and it requires careful planning and attention to detail. In this essay, we will outline the key steps involved in setting up an experiment.
Step 1: Identify the research question
The first step in setting up an experiment is to identify the research question. This involves defining the problem that you want to investigate and the specific questions that you hope to answer. This step is critical because it sets the direction for the entire experiment and ensures that the data collected is relevant and useful.
Step 2: Develop a hypothesis
Once you have identified the research question, the next step is to develop a hypothesis. A hypothesis is a tentative explanation for the phenomenon you want to investigate. It should be testable, measurable, and based on existing evidence or theories. The hypothesis guides the selection of variables, the design of the experiment, and the interpretation of the results.
Step 3: Define the variables
Variables are the factors that can influence the outcome of the experiment. They can be classified as independent, dependent, or control variables. Independent variables are the factors that are manipulated by the experimenter, while dependent variables are the factors that are measured or observed. Control variables are the factors that are kept constant to ensure that they do not influence the outcome of the experiment.
Step 4: Design the experiment
The next step is to design the experiment. This involves selecting the appropriate experimental design, deciding on the sample size, and determining the procedures for collecting and analyzing data. The experimental design should be based on the research question and the hypothesis, and it should allow for the manipulation of the independent variable and the measurement of the dependent variable.
Step 5: Conduct a pilot study
Before conducting the main experiment, it is a good idea to conduct a pilot study. A pilot study is a small-scale version of the experiment that is used to test the procedures and ensure that the data collection and analysis methods are sound. The results of the pilot study can be used to refine the experimental design and make any necessary adjustments.
Step 6: Collect and analyze data
Once the experiment is set up, data collection can begin. It is essential to follow the procedures defined in the experimental design and collect data in a systematic and consistent manner. Once the data is collected, it must be analyzed to test the hypothesis and answer the research question.
Step 7: Draw conclusions and report results
The final step in setting up an experiment is to draw conclusions and report the results. The data should be analyzed to determine whether the hypothesis was supported or rejected, and the results should be reported in a clear and concise manner. The conclusions should be based on the evidence collected and should be supported by statistical analysis and a discussion of the limitations and implications of the study.