-
Chi Square test
The Chi-Square test is a statistical method used to determine if there is a significant association between categorical variables or if a categorical variable follows a hypothesized distribution. There are two main types of Chi-Square tests: the Chi-Square Test of Independence and the Chi-Square Goodness of Fit Test. The Chi-Square Test of Independence assesses whether there is a significant relationship between two categorical variables, while the Goodness of Fit Test evaluates if a single categorical variable matches an expected distribution (Scribbr, n.d.; Statology, n.d.). When reporting Chi-Square test results in APA format, it is essential to specify the type of test conducted, the degrees of freedom, the sample size, the chi-square statistic value rounded to two decimal places, and the p-value rounded to three decimal places without a leading zero (SocSciStatistics, n.d.; Statology, n.d.). For example, a Chi-Square Test of Independence might be reported as follows: “A chi-square test of independence was performed to assess the relationship between gender and sports preference. The relationship between these variables was significant, $$ \chi^2(2, N = 50) = 7.34, p = .025 $$” (Statology, n.d.).
Citations:
[1] https://www.socscistatistics.com/tutorials/chisquare/default.aspx
[2] https://www.statology.org/how-to-report-chi-square-results/
[3] https://ezspss.com/report-chi-square-goodness-of-fit-from-spss-in-apa-style/
[4] https://ezspss.com/how-to-report-chi-square-results-from-spss-in-apa-format/
[5] https://www.scribbr.com/statistics/chi-square-tests/
[6] https://www.youtube.com/watch?v=VjvsrgIJWLE
[7] https://www.scribbr.com/apa-style/numbers-and-statistics/
[8] https://www.youtube.com/watch?v=qjV9-a6uJV0 -
Chi Square test (Chapter 15)
The Chi-Square test, as introduced in Chapter 15 of “Introduction to Statistics in Psychology” by Howitt and Cramer, is a statistical method used to analyze frequency data. This guide will explore its core concepts and practical applications in media research, particularly for first-year media students.
Understanding Frequency Data and the Chi-Square Test
The Chi-Square test is distinct from other statistical tests like the t-test because it focuses on nominal data, which involves categorizing observations into distinct groups. This test is particularly useful for analyzing the frequency of occurrences within each category (Howitt & Cramer, 2020).
Example: In media studies, a researcher might examine viewer preferences for different television genres such as news, drama, comedy, or reality TV. The data collected would be the number of individuals who select each genre, representing frequency counts for each category.
The Chi-Square test helps determine if the observed frequencies significantly differ from what would be expected by chance or if there is a relationship between the variables being studied (Formplus, 2023; Technology Networks, 2024).
When to Use the Chi-Square Test in Media Studies
The Chi-Square test is particularly useful in media research when:
- Examining Relationships Between Categorical Variables: For instance, investigating whether there is a relationship between age groups (young, middle-aged, older) and preferred social media platforms (Facebook, Instagram, Twitter) (GeeksforGeeks, 2024).
- Comparing Observed Frequencies to Expected Frequencies: For example, testing whether the distribution of political affiliations (Democrat, Republican, Independent) in a sample of media consumers matches the known distribution in the general population (BMJ, 2021).
- Analyzing Media Content: Determining if there are significant differences in the portrayal of gender roles (masculine, feminine, neutral) across different types of media (e.g., movies, television shows, advertisements) (BMJ, 2021).
Key Concepts and Calculations
- Contingency Tables: Data for a Chi-Square test is organized into contingency tables that display observed frequencies for each combination of categories.
- Expected Frequencies: These are calculated based on marginal totals in the contingency table and compared to observed frequencies to determine if there is a relationship between variables.
- Chi-Square Statistic ($$χ^2$$): This statistic measures the discrepancy between observed and expected frequencies. A larger value suggests a potential relationship between variables (Howitt & Cramer, 2020; Formplus, 2023).
- Degrees of Freedom: This represents the number of categories that are free to vary in the analysis and influences the critical value used to assess statistical significance.
- Significance Level: A p-value less than 0.05 generally indicates that observed frequencies are statistically significantly different from expected frequencies, rejecting the null hypothesis of no association (Technology Networks, 2024).
Partitioning Chi-Square: Identifying Specific Differences
When dealing with contingency tables larger than 2×2, a significant Chi-Square value only indicates that samples are different overall without specifying which categories contribute to the difference. Partitioning involves breaking down larger tables into multiple 2×2 tests to pinpoint specific differences between categories (BMJ, 2021).
Essential Considerations and Potential Challenges
- Expected Frequencies: Avoid using the Chi-Square test if any expected frequencies are less than 5 as it can lead to inaccurate results.
- Fisher’s Exact Probability Test: For small expected frequencies in 2×2 or 2×3 tables, this test is a suitable alternative.
- Combining Categories: If feasible, combining smaller categories can increase expected frequencies and allow valid Chi-Square analysis.
- Avoiding Percentages: Calculations should always be based on raw frequencies rather than percentages (Technology Networks, 2024).
Software Applications: Simplifying the Process
While manual calculations are possible, statistical software like SPSS simplifies the process significantly. These tools provide step-by-step instructions and visual aids to guide students through executing and interpreting Chi-Square analyses (Howitt & Cramer, 2020; Technology Networks, 2024).
Real-World Applications in Media Research
The versatility of the Chi-Square test is illustrated through diverse research examples:
- Analyzing viewer demographics across different media platforms.
- Examining content portrayal trends over time.
- Investigating audience engagement patterns based on demographic variables.
Key Takeaways for Media Students
- The Chi-Square test is invaluable for analyzing frequency data and exploring relationships between categorical variables in media research.
- Understanding its assumptions and limitations is crucial for accurate result interpretation.
- Statistical software facilitates analysis processes.
- Mastery of this test equips students with essential skills for conducting meaningful research and contributing to media studies.
In conclusion, while this guide provides an overview of the Chi-Square test’s application in media studies, further exploration of statistical concepts is encouraged for comprehensive understanding.
References
BMJ. (2021). The chi-squared tests – The BMJ.
Formplus. (2023). Chi-square test in surveys: What is it & how to calculate – Formplus.
GeeksforGeeks. (2024). Application of chi square test – GeeksforGeeks.
Howitt, D., & Cramer, D. (2020). Introduction to statistics in psychology.
Technology Networks. (2024). The chi-squared test | Technology Networks.
Citations:
[1] https://www.formpl.us/blog/chi-square-test-in-surveys-what-is-it-how-to-calculate
[2] https://fastercapital.com/content/How-to-Use-Chi-square-Test-for-Your-Marketing-Research-and-Test-Your-Hypotheses.html
[3] https://www.geeksforgeeks.org/application-of-chi-square-test/
[4] https://www.bmj.com/about-bmj/resources-readers/publications/statistics-square-one/8-chi-squared-tests
[5] https://www.technologynetworks.com/informatics/articles/the-chi-squared-test-368882
[6] https://fiveable.me/key-terms/communication-research-methods/chi-square-test
[7] https://libguides.library.kent.edu/spss/chisquare
[8] https://www.researchgate.net/figure/Chi-square-Analysis-for-Variable-Time-spent-on-The-Social-Media-and-Gender_tbl1_327477158 -
Guide SPSS How to: Calculate Chi Square
- Open your data file in SPSS.
- Click on “Analyze” in the top menu, then select “Descriptive Statistics” > “Crosstabs”
- In the Crosstabs dialog box:
- Move one categorical variable into the “Row(s)” box.
- Move the other categorical variable into the “Column(s)” box.
- Click on the “Statistics” button and check the box for “Chi-square”
- Click on the “Cells” button and ensure “Observed” is checked under “Counts”
- Click “Continue” and then “OK” to run the analysis.
Interpreting the Results
- Look for the “Chi-Square Tests” table in the output
- Find the “Pearson Chi-Square” row and check the significance value (p-value) in the “Asymptotic Significance (2-sided)” column
- If the p-value is less than your chosen significance level (typically 0.05), you can reject the null hypothesis and conclude there is a significant association between the variables
Main Weakness of Chi-square Test
The main weakness of the Chi-square test is its sensitivity to sample size[3]. Specifically:
- Assumption violation: The test assumes that the expected frequency in each cell should be 5 or more in at least 80% of the cells, and no cell should have an expected frequency of less than 1
- Sample size issues:
- With small sample sizes, the test may not be valid as it’s more likely to violate the above assumption.
- With very large sample sizes, even small, practically insignificant differences can appear statistically significant.
To address this weakness, always check the “Expected Count” in your output to ensure the assumption is met. If not, consider combining categories or using alternative tests for small samples, such as Fisher’s Exact Test for 2×2 tables
-
Bivariate Analysis: Understanding Correlation, t-test, and Chi Square test
Bivariate analysis is a statistical technique used to examine the relationship between two variables. This type of analysis is often used in fields such as psychology, economics, and sociology to study the relationship between two variables and determine if there is a significant relationship between them.
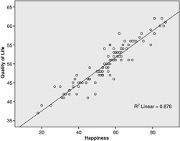
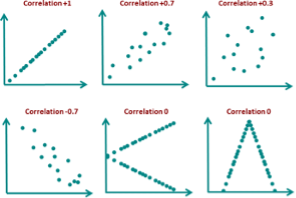
Correlation
Correlation is a measure of the strength and direction of the relationship between two variables. A positive correlation means that as one variable increases, the other variable also increases, and vice versa. A negative correlation means that as one variable increases, the other decreases. The strength of the correlation is indicated by a correlation coefficient, which ranges from -1 to +1. A coefficient of -1 indicates a perfect negative correlation, +1 indicates a perfect positive correlation, and 0 indicates no correlation.
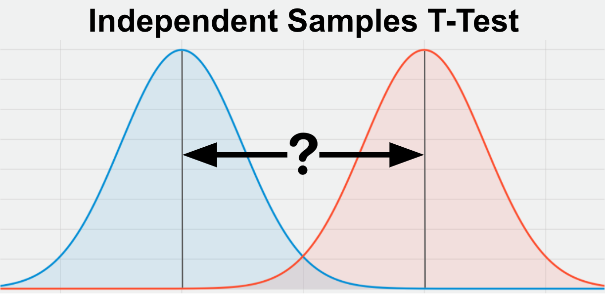
T-Test
A t-test is a statistical test that compares the means of two groups to determine if there is a significant difference between them. The t-test is commonly used to test the hypothesis that the means of two populations are equal. If the t-statistic is greater than the critical value, then the difference between the means is considered significant.
Chi Square Test
The chi square test is a statistical test used to determine if there is a significant association between two categorical variables. The test measures the difference between the observed frequencies and the expected frequencies in a contingency table. If the calculated chi square statistic is greater than the critical value, then the association between the two variables is considered significant.
Significance
Significance in statistical analysis refers to the likelihood that an observed relationship between two variables is not due to chance. In other words, it measures the probability that the relationship is real and not just a random occurrence. In statistical analysis, a relationship is considered significant if the p-value is less than a set alpha level, usually 0.05.
In conclusion, bivariate analysis is an important tool for understanding the relationship between two variables. Correlation, t-test, and chi square test are three commonly used methods for bivariate analysis, each with its own strengths and weaknesses. It is important to understand the underlying assumptions and limitations of each method and to choose the appropriate test based on the research question and the type of data being analyzed