-
Correlation (Scale Variables)
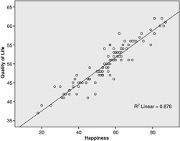
Correlation for scale variables is often assessed using the Pearson correlation coefficient, denoted as $$ r $$, which measures the linear relationship between two continuous variables (Statology, n.d.; Scribbr, n.d.). The value of $$ r $$ ranges from -1 to 1, where -1 indicates a perfect negative linear correlation, 0 indicates no linear correlation, and 1 indicates a perfect positive linear correlation (Statology, n.d.). When reporting the Pearson correlation in APA format, it is essential to include the strength and direction of the relationship, the degrees of freedom (calculated as $$ N – 2 $$), and the p-value to determine statistical significance (PsychBuddy, n.d.; Statistics Solutions, n.d.). For example, a significant positive correlation might be reported as $$ r(38) = .48, p = .002 $$, indicating a moderate positive relationship between the variables studied (Statology, n.d.; Scribbr, n.d.). It is crucial to italicize $$ r $$, omit leading zeros in both $$ r $$ and p-values, and round these values to two and three decimal places, respectively (Scribbr, n.d.; Statistics Solutions, n.d.).
References
PsychBuddy. (n.d.). Results Tip! How to Report Correlations. Retrieved from https://www.psychbuddy.com.au/post/correlation
Scribbr. (n.d.). Pearson Correlation Coefficient (r) | Guide & Examples. Retrieved from https://www.scribbr.com/statistics/pearson-correlation-coefficient/
Scribbr. (n.d.). Reporting Statistics in APA Style | Guidelines & Examples. Retrieved from https://www.scribbr.com/apa-style/numbers-and-statistics/
Statology. (n.d.). How to Report Pearson’s r in APA Format (With Examples). Retrieved from https://www.statology.org/how-to-report-pearson-correlation/
Statistics Solutions. (n.d.). Reporting Statistics in APA Format. Retrieved from https://www.statisticssolutions.com/reporting-statistics-in-apa-format/
Citations:
[1] https://www.statology.org/how-to-report-pearson-correlation/
[2] https://www.scribbr.com/statistics/pearson-correlation-coefficient/
[3] https://www.psychbuddy.com.au/post/correlation
[4] https://www.statisticssolutions.com/reporting-statistics-in-apa-format/
[5] https://www.socscistatistics.com/tutorials/correlation/default.aspx
[6] https://www.scribbr.com/apa-style/numbers-and-statistics/
[7] https://apastyle.apa.org/style-grammar-guidelines/tables-figures/sample-tables
[8] https://www.youtube.com/watch?v=fCf0YYVLKTU -
Correlation Ordinal Variables
Correlation for ordinal variables is typically assessed using Spearman’s rank correlation coefficient, which is a non-parametric measure suitable for ordinal data that does not assume a normal distribution (Scribbr, n.d.). Unlike Pearson’s correlation, which requires interval or ratio data and assumes linear relationships, Spearman’s correlation can handle non-linear monotonic relationships and is robust to outliers. This makes it ideal for ordinal variables, where data are ranked but not measured on a continuous scale (Scribbr, n.d.). When reporting Spearman’s correlation in APA style, it is important to italicize the symbol $$ r_s $$ and report the value to two decimal places (Purdue OWL, n.d.). Additionally, the significance level should be clearly stated to inform readers of the statistical reliability of the findings (APA Style, n.d.).
References
APA Style. (n.d.). Sample tables. American Psychological Association. Retrieved from https://apastyle.apa.org/style-grammar-guidelines/tables-figures/sample-tables
Purdue OWL. (n.d.). Numbers and statistics. Purdue Online Writing Lab. Retrieved from https://owl.purdue.edu/owl/research_and_citation/apa_style/apa_formatting_and_style_guide/apa_numbers_statistics.html
Scribbr. (n.d.). Pearson correlation coefficient (r) | Guide & examples. Scribbr. Retrieved from https://www.scribbr.com/statistics/pearson-correlation-coefficient/
-
Correlation (Chapter 8)
Understanding Correlation in Media Research: A Look at Chapter 8
Correlation analysis is a fundamental statistical tool in media research, allowing researchers to explore relationships between variables and draw meaningful insights. Chapter 8 of “Introduction to Statistics in Psychology” by Howitt and Cramer (2020) provides valuable information on correlation, which can be applied to media studies. This essay will explore key concepts from the chapter, adapting them to the context of media research and highlighting their relevance for first-year media students.
The Power of Correlation Coefficients
While scattergrams offer visual representations of relationships between variables, correlation coefficients provide a more precise quantification. As Howitt and Cramer (2020) explain, a correlation coefficient summarizes the key features of a scattergram in a single numerical index, indicating both the direction and strength of the relationship between two variables.
The Pearson Correlation Coefficient
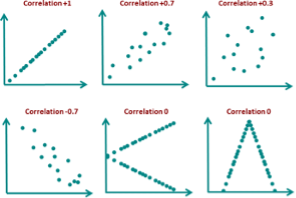
The Pearson correlation coefficient, denoted as “r,” is the most commonly used measure of correlation in media research. It ranges from -1 to +1, with -1 indicating a perfect negative correlation, +1 a perfect positive correlation, and 0 signifying no correlation (Howitt & Cramer, 2020). Values between these extremes represent varying degrees of correlation strength.
Interpreting Correlation Coefficients in Media Research
For media students, the ability to interpret correlation coefficients is crucial. Consider the following example:
A study examining the relationship between social media usage and academic performance among college students found a moderate negative correlation (r = -0.45, p < 0.01)[1]. This suggests that as social media usage increases, academic performance tends to decrease, though the relationship is not perfect.
It’s important to note that correlation does not imply causation. As Howitt and Cramer (2020) emphasize, even strong correlations do not necessarily indicate a causal relationship between variables.
The Coefficient of Determination
Chapter 8 introduces the coefficient of determination (r²), which represents the proportion of shared variance between two variables. In media research, this concept is particularly useful for understanding the predictive power of one variable over another.
For instance, in the previous example, r² would be 0.2025, indicating that approximately 20.25% of the variance in academic performance can be explained by social media usage[1].
Statistical Significance in Correlation Analysis
Howitt and Cramer (2020) briefly touch on significance testing, which is crucial for determining whether an observed correlation reflects a genuine relationship in the population or is likely due to chance. In media research, reporting p-values alongside correlation coefficients is standard practice.
Spearman’s Rho: An Alternative to Pearson’s r
For ordinal data, which is common in media research (e.g., rating scales for media content), Spearman’s rho is an appropriate alternative to Pearson’s r. Howitt and Cramer (2020) explain that this coefficient is used when data are ranked rather than measured on a continuous scale.
Correlation in Media Research: Real-World Applications
Recent studies have demonstrated the practical applications of correlation analysis in media research. For example, a study on social media usage and reading ability among English department students found a high positive correlation (r = 0.622) between these variables[2]. This suggests that increased social media usage is associated with improved reading ability, though causal relationships cannot be inferred.
SPSS: A Valuable Tool for Correlation Analysis
As Howitt and Cramer (2020) note, SPSS is a powerful statistical software package that simplifies complex analyses, including correlation. Familiarity with SPSS can be a significant asset for media students conducting research.
References:
Howitt, D., & Cramer, D. (2020). Introduction to Statistics in Psychology (7th ed.). Pearson.
[1] Editage Insights. (2024, September 9). Demystifying Pearson’s r: A handy guide. https://www.editage.com/insights/demystifying-pearsons-r-a-handy-guide
[2] IDEAS. (2022). The Correlation between Social Media Usage and Reading Ability of the English Department Students at University of Riau. IDEAS, 10(2), 2207. https://ejournal.iainpalopo.ac.id/index.php/ideas/article/download/3228/2094/11989
-
Guide SPSS How to: Correlation
Calculating Correlation in SPSS
Step 1: Prepare Your Data
- Enter your data into SPSS, with each variable in a separate column.
- Ensure your variables are measured on an interval or ratio scale for Pearson’s r, or ordinal scale for Spearman’s rho
Step 2: Access the Correlation Analysis Tool
- Click on “Analyze” in the top menu.
- Select “Correlate” from the dropdown menu.
- Choose “Bivariate” from the submenu
Step 3: Select Variables
- In the new window, move your variables of interest into the “Variables” box.
- You can select multiple variables to create a correlation matrix
Step 4: Choose Correlation Coefficient
- For Pearson’s r: Ensure “Pearson” is checked (it’s usually the default).
- For Spearman’s rho: Check the “Spearman” box
Step 5: Additional Options
- Under “Test of Significance,” select “Two-tailed” unless you have a specific directional hypothesis.
- Check “Flag significant correlations” to highlight significant results
Step 6: Run the Analysis
- Click “OK” to generate the correlation output
Interpreting the Results
Correlation Coefficient
- The value ranges from -1 to +1.
- Positive values indicate a positive relationship, negative values indicate an inverse relationship[1].
- Strength of correlation:
- 0.00 to 0.29: Weak
- 0.30 to 0.49: Moderate
- 0.50 to 1.00: Strong
Statistical Significance
- Look for p-values less than 0.05 (or your chosen significance level) to determine if the correlation is statistically significant.
Sample Size
- The output will also show the sample size (n) for each correlation.
Remember, correlation does not imply causation. Always interpret your results in the context of your research question and theoretical framework.
To interpret the results of a Pearson correlation in SPSS, focus on these key elements:
- Correlation Coefficient (r): This value ranges from -1 to +1 and indicates the strength and direction of the relationship between variables
- Positive values indicate a positive relationship, negative values indicate an inverse relationship.
- Strength interpretation:
- 0.00 to 0.29: Weak correlation
- 0.30 to 0.49: Moderate correlation
- 0.50 to 1.00: Strong correlation
- Statistical Significance: Look at the “Sig. (2-tailed)” value
- If this value is less than your chosen significance level (typically 0.05), the correlation is statistically significant.
- Significant correlations are often flagged with asterisks in the output.
- Sample Size (n): This indicates the number of cases used in the analysis
Example Interpretation
Let’s say you have a correlation coefficient of 0.228 with a significance value of 0.060:
- The correlation coefficient (0.228) indicates a weak positive relationship between the variables.
- The significance value (0.060) is greater than 0.05, meaning the correlation is not statistically significant
- This suggests that while a small positive correlation was observed in the sample, there’s not enough evidence to conclude that this relationship exists in the population
- Remember, correlation does not imply causation. Always interpret results in the context of your research question and theoretical framework.
-
Bivariate Analysis: Understanding Correlation, t-test, and Chi Square test
Bivariate analysis is a statistical technique used to examine the relationship between two variables. This type of analysis is often used in fields such as psychology, economics, and sociology to study the relationship between two variables and determine if there is a significant relationship between them.
Correlation
Correlation is a measure of the strength and direction of the relationship between two variables. A positive correlation means that as one variable increases, the other variable also increases, and vice versa. A negative correlation means that as one variable increases, the other decreases. The strength of the correlation is indicated by a correlation coefficient, which ranges from -1 to +1. A coefficient of -1 indicates a perfect negative correlation, +1 indicates a perfect positive correlation, and 0 indicates no correlation.
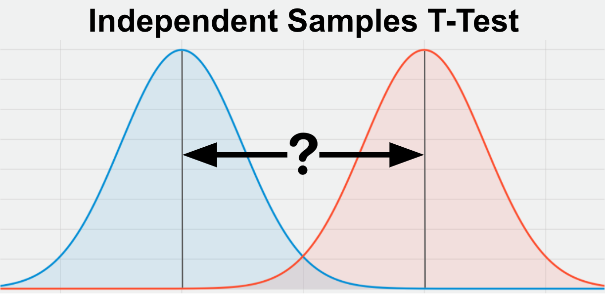
T-Test
A t-test is a statistical test that compares the means of two groups to determine if there is a significant difference between them. The t-test is commonly used to test the hypothesis that the means of two populations are equal. If the t-statistic is greater than the critical value, then the difference between the means is considered significant.
Chi Square Test
The chi square test is a statistical test used to determine if there is a significant association between two categorical variables. The test measures the difference between the observed frequencies and the expected frequencies in a contingency table. If the calculated chi square statistic is greater than the critical value, then the association between the two variables is considered significant.
Significance
Significance in statistical analysis refers to the likelihood that an observed relationship between two variables is not due to chance. In other words, it measures the probability that the relationship is real and not just a random occurrence. In statistical analysis, a relationship is considered significant if the p-value is less than a set alpha level, usually 0.05.
In conclusion, bivariate analysis is an important tool for understanding the relationship between two variables. Correlation, t-test, and chi square test are three commonly used methods for bivariate analysis, each with its own strengths and weaknesses. It is important to understand the underlying assumptions and limitations of each method and to choose the appropriate test based on the research question and the type of data being analyzed