Auteur: admin

  • Check List Survey

    Alignment with Research Objectives

    • Each question directly relates to at least one research objective
    • All research objectives are addressed by the questionnaire
    • No extraneous questions that don’t contribute to the research goals

    Question Relevance and Specificity

    • Questions are specific enough to gather precise data
    • Questions are relevant to the target population
    • Questions capture the intended constructs or variables

    Comprehensiveness

    • All key aspects of the research topic are covered
    • Sufficient depth is achieved in exploring complex topics
    • No critical areas of inquiry are omitted

    Logical Flow and Structure

    • Questions are organized in a logical sequence
    • Related questions are grouped together
    • The questionnaire progresses from general to specific topics (if applicable)

    Data Quality and Usability

    • Questions will yield data in the format needed for analysis
    • Response options are appropriate for the intended statistical analyses
    • Questions avoid double-barreled or compound issues

    Respondent Engagement

    • Questions are engaging and maintain respondent interest
    • Survey length is appropriate to avoid fatigue or dropout
    • Sensitive questions are appropriately placed and worded

    Clarity and Comprehension

    • Questions are easily understood by the target population
    • Technical terms or jargon are defined if necessary
    • Instructions are clear and unambiguous

    Bias Mitigation

    • Questions are neutrally worded to avoid leading respondents
    • Response options are balanced and unbiased
    • Social desirability bias is minimized in sensitive topics

    Measurement Precision

    • Scales used are appropriate for measuring the constructs
    • Sufficient response options are provided for nuanced data collection
    • Questions capture the required level of detail

    Validity Checks

    • Includes items to check for internal consistency (if applicable)
    • Contains control or validation questions to ensure data quality
    • Allows for cross-verification of key information

    Adaptability and Flexibility

    • Questions allow for unexpected or diverse responses
    • Open-ended questions are included where appropriate for rich data
    • Skip logic is properly implemented for relevant subgroups

    Actionability of Results

    • Data collected will lead to actionable insights
    • Questions address both current state and potential future states
    • Results will inform decision-making related to research goals

    Ethical Considerations

    • Questions respect respondent privacy and sensitivity
    • The questionnaire adheres to ethical guidelines in research
    • Consent and confidentiality are appropriately addressed
  • How to Create a Survey

    What is a great survey? 

    A great online survey provides you with clear, reliable, actionable insight to inform your decision-making. Great surveys have higher response rates, higher quality data and are easy to fill out. 

    Follow these 10 tips to create great surveys, improve the response rate of your survey, and improve the quality of the data you gather. 

    10 steps to create a great survey 

    1. Clearly define the purpose of your online survey 

    For BUAS we use Qualtrics which is a web–based online survey tool packed with industry–leading features designed by noted market researchers. 

    Fuzzy goals lead to fuzzy results, and the last thing you want to end up with is a set of results that provide no real decision–enhancing value. Good surveys have focused objectives that are easily understood. Spend time up front to identify, in writing: 

    • What is the goal of this survey? 
    • Why are you creating this survey? 
    • What do you hope to accomplish with this survey? 
    • How will you use the data you are collecting? 
    • What decisions do you hope to impact with the results of this survey? (This will later help you identify what data you need to collect in order to make these decisions.) 

    Sounds obvious, but we have seen plenty of surveys where a few minutes of planning could have made the difference between receiving quality responses (responses that are useful as inputs to decisions) or un–interpretable data. 

    Consider the case of the software firm that wanted to find out what new functionality was most important to customers. The survey asked ‘How can we improve our product?’ The resulting answers ranged from ‘Make it easier’ to ‘Add an update button on the recruiting page.’ While interesting information, this data is not really helpful for the product manager who wanted to make an itemized list for the development team, with customer input as a prioritization variable. 

    Spending time identifying the objective might have helped the survey creators determine: 

    • Are we trying to understand our customers’ perception of our software in order to identify areas of improvement (e.g. hard to use, time consuming, unreliable)? 
    • Are we trying to understand the value of specific enhancements? They would have been better off asking customers to please rank from 1 – 5 the importance of adding X new functionality. 

    Advance planning helps ensure that the survey asks the right questions to meet the objective and generate useful data. 

    2. Keep the survey short and focused 

    Short and focused helps with both quality and quantity of response. It is generally better to focus on a single objective than try to create a master survey that covers multiple objectives. 

    Shorter surveys generally have higher response rates and lower abandonment among survey respondents. It’s human nature to want things to be quick and easy – once a survey taker loses interest they simply abandon the task – leaving you to determine how to interpret that partial data set (or whether to use it all). 

    Make sure each of your questions is focused on helping to meet your stated objective. Don’t toss in ‘nice to have’ questions that don’t directly provide data to help you meet your objectives. 

    To be certain that the survey is short; time a few people taking the survey. SurveyMonkey research (along with Gallup and others) has shown that the survey should take 5 minutes or less to complete. 6 – 10 minutes is acceptable but we see significant abandonment rates occurring after 11 minutes. 

    3. Keep the questions simple 

    Make sure your questions get to the point and avoid the use of jargon. We on the SurveyMonkey team have often received surveys with questions along the lines of: “When was the last time you used our RGS?” (What’s RGS?) Don’t assume that your survey takers are as comfortable with your acronyms as you are. 

    Try to make your questions as specific and direct as possible. Compare: What has your experience been working with our HR team? To: How satisfied are you with the response time of our HR team? 

    4. Use closed ended questions whenever possible 

    Closed ended survey questions give respondents specific choices (e.g. Yes or No), making it easier to analyze results. Closed ended questions can take the form of yes/no, multiple choice or rating scale. Open ended survey questions allow people to answer a question in their own words. Open–ended questions are great supplemental questions and may provide useful qualitative information and insights. However, for collating and analysis purposes, closed ended questions are preferable. 

    5. Keep rating scale questions consistent through the survey 

    Rating scales are a great way to measure and compare sets of variables. If you elect to use rating scales (e.g. from 1 – 5) keep it consistent throughout the survey. Use the same number of points on the scale and make sure meanings of high and low stay consistent throughout the survey. Also, use an odd number in your rating scale to make data analysis easier. Switching your rating scales around will confuse survey takers, which will lead to untrustworthy responses. 

    6. Logical ordering 

    Make sure your survey flows in a logical order. Begin with a brief introduction that motivates survey takers to complete the survey (e.g. “Help us improve our service to you. Please answer the following short survey.”). Next, it is a good idea to start from broader–based questions and then move to those narrower in scope. It is usually better to collect demographic data and ask any sensitive questions at the end (unless you are using this information to screen out survey participants). If you are asking for contact information, place that information last. 

    7. Pre–test your survey 

    Make sure you pre–test your survey with a few members of your target audience and/or co–workers to find glitches and unexpected question interpretations. 

    8. Consider your audience when sending survey invitations 

    Recent statistics show the highest open and click rates take place on Monday, Friday and Sunday. In addition, our research shows that the quality of survey responses does not vary from weekday to weekend. That being said, it is most important to consider your audience. For instance, for employee surveys, you should send during the business week and at a time that is suitable for your business. i.e. if you are a sales driven business avoid sending to employees at month end when they are trying to close business. 

    9. Consider sending several reminders 

    While not appropriate for all surveys, sending out reminders to those who haven’t previously responded can often provide a significant boost in response rates. 

    10. Consider offering an incentive 

    Depending upon the type of survey and survey audience, offering an incentive is usually very effective at improving response rates. People like the idea of getting something for their time. SurveyMonkey research has shown that incentives typically boost response rates by 50% on average. 

    One caveat is to keep the incentive appropriate in scope. Overly large incentives can lead to undesirable behavior, for example, people lying about demographics in order to not be screened out from the survey. 
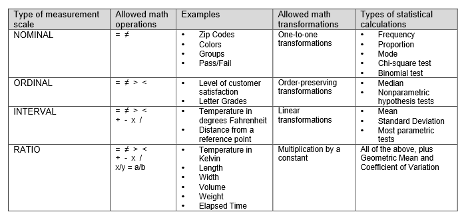
  • Univariate Analysis: Understanding Measures of Central Tendency and Dispersion

    Univariate analysis is a statistical method that focuses on analyzing one variable at a time. In this type of analysis, we try to understand the characteristics of a single variable by using various statistical techniques. The main objective of univariate analysis is to get a comprehensive understanding of a single variable, its distribution, and its relationship with other variables. 

    Measures of Central Tendency 

     Measures of central tendency are statistical measures that help us to determine the center of a dataset. They give us an idea of where most of the data lies and what is the average value of a dataset. There are three main measures of central tendency: mean, median, and mode. 

    1. Mean The mean, also known as the average, is calculated by adding up all the values of a dataset and then dividing the sum by the total number of values. It is represented by the symbol ‘μ’ (mu) in statistics. The mean is the most commonly used measure of central tendency. 
    1. Median The median is the middle value of a dataset when the data is arranged in ascending or descending order. If the number of values in a dataset is odd, the median is the middle value. If the number of values is even, the median is the average of the two middle values. 
    1. Mode The mode is the value that appears most frequently in a dataset. It is the most common value in a dataset. A dataset can have one mode, multiple modes, or no mode. 

    Measures of Dispersion 

    Measures of dispersion are statistical measures that help us to determine the spread of a dataset. They give us an idea of how far the values in a dataset are spread out from the central tendency. There are two main measures of dispersion: range and standard deviation. 

    1. Range The range is the difference between the largest and smallest values in a dataset. It gives us an idea of how much the values in a dataset vary. 
    1. Standard Deviation The standard deviation is a measure of how much the values in a dataset vary from the mean. It is represented by the symbol ‘σ’ (sigma) in statistics. The standard deviation is a more precise measure of dispersion than the range. 

    Conclusion 

    In conclusion, univariate analysis is a statistical method that helps us to understand the characteristics of a single variable. Measures of central tendency and measures of dispersion are two important concepts in univariate analysis that help us to determine the center and spread of a dataset. Understanding these concepts is crucial for analyzing data and making informed decisions. 

  • Methods of Conducting Quantitative Research

    Quantitative research is a type of research that uses numerical data and statistical analysis to understand and explain phenomena. It is a systematic and objective method of collecting, analyzing, and interpreting data to answer research questions and test hypotheses.

    conduct

    The following are some of the commonly used methods for conducting quantitative research:

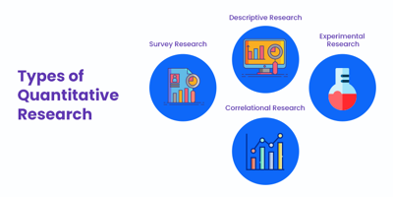
    1. Survey research: This method involves collecting data from a large number of individuals through self-administered questionnaires or interviews. Surveys can be administered in person, by mail, by phone, or online.
    2. Experimental research: In experimental research, the researcher manipulates an independent variable to observe the effect on a dependent variable. The goal is to establish cause-and-effect relationships between variables.
    3. Quasi-experimental research: This method is similar to experimental research, but the researcher does not have full control over the assignment of participants to groups.
    4. Correlational research: This method involves examining the relationship between two or more variables without manipulating any of them. The goal is to identify patterns of association between variables.
    5. Longitudinal research: This method involves collecting data from the same individuals over an extended period of time. The goal is to study changes in variables over time and understand the underlying processes.
    6. Cross-sectional research: This method involves collecting data from different individuals at the same point in time. The goal is to study differences between groups and understand the prevalence of variables in a population.
    7. Case study research: This method involves in-depth examination of a single individual or group. The goal is to gain a comprehensive understanding of a phenomenon.

    It is important to choose the appropriate method based on the research question and the type of data being analyzed. For example, if the goal is to establish cause-and-effect relationships, an experimental design is more appropriate than a survey design.

    Quantitative research is a valuable tool for understanding and explaining phenomena in a systematic and objective way. By selecting the appropriate method, researchers can collect and analyze data to answer their research questions and test hypotheses.

  • Bivariate Analysis: Understanding Correlation, t-test, and Chi Square test

    Bivariate analysis is a statistical technique used to examine the relationship between two variables. This type of analysis is often used in fields such as psychology, economics, and sociology to study the relationship between two variables and determine if there is a significant relationship between them.

    Correlation

    Correlation is a measure of the strength and direction of the relationship between two variables. A positive correlation means that as one variable increases, the other variable also increases, and vice versa. A negative correlation means that as one variable increases, the other decreases. The strength of the correlation is indicated by a correlation coefficient, which ranges from -1 to +1. A coefficient of -1 indicates a perfect negative correlation, +1 indicates a perfect positive correlation, and 0 indicates no correlation.

    T-Test

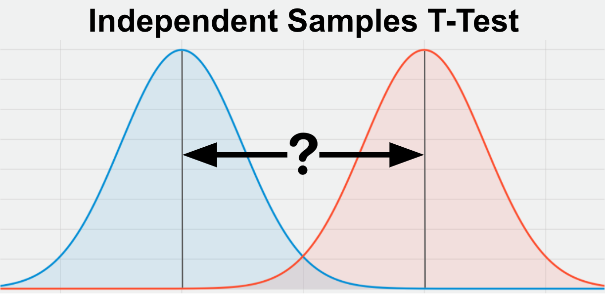
    A t-test is a statistical test that compares the means of two groups to determine if there is a significant difference between them. The t-test is commonly used to test the hypothesis that the means of two populations are equal. If the t-statistic is greater than the critical value, then the difference between the means is considered significant.

    Chi Square Test

    The chi square test is a statistical test used to determine if there is a significant association between two categorical variables. The test measures the difference between the observed frequencies and the expected frequencies in a contingency table. If the calculated chi square statistic is greater than the critical value, then the association between the two variables is considered significant.

    Significance

    Significance in statistical analysis refers to the likelihood that an observed relationship between two variables is not due to chance. In other words, it measures the probability that the relationship is real and not just a random occurrence. In statistical analysis, a relationship is considered significant if the p-value is less than a set alpha level, usually 0.05.

    In conclusion, bivariate analysis is an important tool for understanding the relationship between two variables. Correlation, t-test, and chi square test are three commonly used methods for bivariate analysis, each with its own strengths and weaknesses. It is important to understand the underlying assumptions and limitations of each method and to choose the appropriate test based on the research question and the type of data being analyzed

  • Developing a Hypothesis

    A hypothesis is a statement that predicts the relationship between two or more variables. It is a crucial step in the scientific process, as it sets the direction for further investigation and helps researchers to determine whether their assumptions and predictions are supported by evidence. In this blog post, we will discuss the steps involved in developing a hypothesis and provide tips for making your hypothesis as effective as possible.

    Step 1: Identify a Research Problem

    The first step in developing a hypothesis is to identify a research problem. This can be done by reviewing the literature in your field, consulting with experts, or simply observing a phenomenon that you find interesting. Once you have identified a problem, you should clearly define the question you want to answer and determine the variables that may be relevant to the problem.

    Step 2: Conduct a Literature Review

    Once you have defined your research problem, the next step is to conduct a literature review. This will help you to understand what is already known about the topic, identify gaps in the literature, and determine what has been done and what still needs to be done. During this step, you should also identify any potential biases, limitations, or gaps in the existing research, as this will help you to refine your hypothesis and avoid making the same mistakes as previous researchers.

    Step 3: Formulate a Hypothesis

    With a clear understanding of the research problem and existing literature, you can now formulate a hypothesis. A well-written hypothesis should be clear, concise, and specific, and should specify the variables that you expect to be related. For example, if you are studying the relationship between exercise and weight loss, your hypothesis might be: “Regular exercise will lead to significant weight loss.”

    • The null hypothesis and the alternative hypothesis are two types of hypotheses that are used in statistical testing.

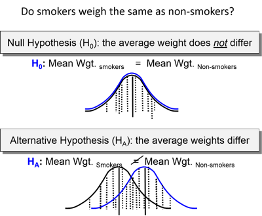
    The null hypothesis (H0) is a statement that predicts that there is no significant relationship between the variables being studied. In other words, the null hypothesis assumes that any observed relationship between the variables is due to chance or random error. The null hypothesis is the default position and is assumed to be true unless evidence is found to reject it.

    • The alternative hypothesis (H1), on the other hand, is a statement that predicts that there is a significant relationship between the variables being studied. The alternative hypothesis is what the researcher is trying to prove, and is the opposite of the null hypothesis. In statistical testing, the goal is to determine whether there is sufficient evidence to reject the null hypothesis in favor of the alternative hypothesis.

    When conducting statistical tests, researchers typically set a significance level, which is the probability of rejecting the null hypothesis when it is actually true. The most commonly used significance level is 0.05, which means that there is a 5% chance of rejecting the null hypothesis when it is actually true.

    It is important to note that the null hypothesis and alternative hypothesis should be complementary and exhaustive, meaning that they should cover all possible outcomes of the study and that only one of the hypotheses can be true. The results of the statistical test will either support the null hypothesis or provide evidence to reject it in favor of the alternative hypothesis.

    Step 4: Refine and Test Your Hypothesis

    Once you have formulated a hypothesis, you should refine it based on your literature review and any additional information you have gathered. This may involve making changes to the variables you are studying, adjusting the methods you will use to test your hypothesis, or modifying your hypothesis to better reflect your research question.

    Once your hypothesis is refined, you can then test it using a variety of methods, such as surveys, experiments, or observational studies. The results of your study should provide evidence to support or reject your hypothesis, and will inform the next steps in your research process.

    Tips for Developing Effective Hypotheses:

    1. Be Specific: Your hypothesis should clearly state the relationship between the variables you are studying, and should avoid using vague or imprecise language.
    2. Be Realistic: Your hypothesis should be based on existing knowledge and should be feasible to test.
    3. Avoid Confirmation Bias: Be open to the possibility that your hypothesis may be wrong, and avoid assuming that your results will support your hypothesis before you have collected and analyzed the data.
    4. Consider Alternative Hypotheses: Be sure to consider alternative explanations for the relationship between the variables you are studying, and be prepared to revise your hypothesis if your results suggest a different relationship.

    Developing a hypothesis is a critical step in the scientific process and is essential for conducting rigorous and reliable research. By following the steps outlined above, and by keeping these tips in mind, you can develop an effective and well-supported hypothesis that will guide your research and lead to new insights and discoveries

  • Distributions

    When working with datasets, it is important to understand the central tendency and dispersion of the data. These measures give us a general idea of how the data is distributed and what its typical values are. However, when the data is skewed or has outliers, it can be difficult to determine the central tendency and dispersion accurately. In this blog post, we’ll explore how to deal with skewed datasets and how to choose the appropriate measures of central tendency and dispersion.

    What is a Skewed Dataset?

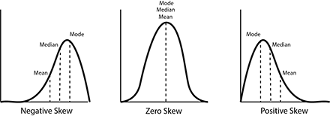
    A skewed dataset is one in which the values are not evenly distributed. Instead, the data is skewed towards one end of the scale. There are two types of skewness: positive and negative. In a positive skewed dataset, the values are skewed to the right, while in a negative skewed dataset, the values are skewed to the left.

    Measures of Central Tendency

    Measures of central tendency are used to determine the typical value or center of a dataset. The three most commonly used measures of central tendency are the mean, median, and mode.

    1. Mean: The mean is the sum of all the values in the dataset divided by the number of values. It gives us an average value for the dataset.
    2. Median: The median is the middle value in a dataset. If the dataset has an odd number of values, the median is the value in the middle. If the dataset has an even number of values, the median is the average of the two middle values.
    3. Mode: The mode is the value that occurs most frequently in the dataset.

    In a skewed dataset, the mean is often skewed in the same direction as the data. This means that the mean may not accurately represent the typical value in a skewed dataset. In these cases, the median is often a better measure of central tendency. The median gives us the middle value in the dataset, which is not affected by outliers or skewness.

    Measures of Dispersion

    Measures of dispersion are used to determine how spread out the values in a dataset are. The two most commonly used measures of dispersion are the range and the standard deviation.

    1. Range: The range is the difference between the highest and lowest values in the dataset.
    2. Standard deviation: The standard deviation is a measure of how much the values in a dataset vary from the mean.

    In a skewed dataset, the range and standard deviation may be affected by outliers or skewness. In these cases, it is important to use other measures of dispersion, such as the interquartile range or trimmed mean, to get a more accurate representation of the dispersion in the data.

    When dealing with skewed datasets, it is important to choose the appropriate measures of central tendency and dispersion. The mean, median, and mode are measures of central tendency, while the range and standard deviation are measures of dispersion. In a skewed dataset, the mean may not accurately represent the typical value, and the range and standard deviation may be affected by outliers or skewness. In these cases, it is often better to use the median or other measures of dispersion to get a more accurate representation of the data.

  • Example setup Experimental Design

    Experimental design is a crucial aspect of media studies research, as it allows researchers to test hypotheses about media effects and gain insights into the ways that media affects individuals and society. In this blog post, we will delve into the basics of experimental design in media studies and provide examples of its application.

    Step 1: Define the Research Question The first step in any experimental design is to formulate a research question. In media studies, research questions might involve the effects of media content on attitudes, behaviors, or emotions. For example, “Does exposure to violent media increase aggressive behavior in adolescents?”

    Step 2: Develop a Hypothesis Once the research question has been defined, the next step is to develop a hypothesis. In media studies, hypotheses may predict the relationship between media exposure and a particular outcome. For example, “Adolescents who are exposed to violent media will exhibit higher levels of aggressive behavior compared to those who are not exposed.”

    Step 3: Choose the Experimental Design There are several experimental designs to choose from in media studies, including laboratory experiments, field experiments, and natural experiments. The choice of experimental design depends on the research question and the type of data being collected. For example, a laboratory experiment might be used to test the effects of violent media on aggressive behavior, while a field experiment might be used to study the impact of media literacy programs on critical media consumption.

    Step 4: Determine the Sample Size The sample size is the number of participants or subjects in the study. In media studies, sample size should be large enough to produce statistically significant results, but small enough to be manageable and cost-effective. For example, a study on the effects of violent media might include 100 adolescent participants.

    Step 5: Control for Confounding Variables Confounding variables are factors that may affect the outcome of the experiment and lead to incorrect conclusions. In media studies, confounding variables might include individual differences in personality, preexisting attitudes, or exposure to other sources of violence. It is essential to control for these variables by holding them constant or randomly assigning them to different groups.

    Step 6: Collect and Analyze Data The next step is to collect data and analyze it to test the hypothesis. In media studies, data might include measures of media exposure, attitudes, behaviors, or emotions. The data should be collected in a systematic and reliable manner and analyzed using statistical methods.

    Step 7: Draw Conclusions Based on the results of the experiment, conclusions can be drawn about the research question. The conclusions should be based on the data collected and should be reported in a clear and concise manner. For example, if the results of a study on the effects of violent media support the hypothesis, the conclusion might be that “Exposure to violent media does increase aggressive behavior in adolescents.”

    In conclusion, experimental design is a critical aspect of media studies research and is used to test hypotheses about media effects and gain insights into the ways that media affects individuals and society. By following the seven steps outlined in this blog post, media studies researchers can increase the reliability and validity of their results and contribute to our understanding of the impact of media on society.

  • Experimental Design

    Experiments are a fundamental part of the scientific method, allowing researchers to systematically investigate phenomena and test hypotheses. Setting up an experiment is a crucial step in the process of conducting research, and it requires careful planning and attention to detail. In this essay, we will outline the key steps involved in setting up an experiment.

    Step 1: Identify the research question

    The first step in setting up an experiment is to identify the research question. This involves defining the problem that you want to investigate and the specific questions that you hope to answer. This step is critical because it sets the direction for the entire experiment and ensures that the data collected is relevant and useful.

    Step 2: Develop a hypothesis

    Once you have identified the research question, the next step is to develop a hypothesis. A hypothesis is a tentative explanation for the phenomenon you want to investigate. It should be testable, measurable, and based on existing evidence or theories. The hypothesis guides the selection of variables, the design of the experiment, and the interpretation of the results.

    Step 3: Define the variables

    Variables are the factors that can influence the outcome of the experiment. They can be classified as independent, dependent, or control variables. Independent variables are the factors that are manipulated by the experimenter, while dependent variables are the factors that are measured or observed. Control variables are the factors that are kept constant to ensure that they do not influence the outcome of the experiment.

    Step 4: Design the experiment

    The next step is to design the experiment. This involves selecting the appropriate experimental design, deciding on the sample size, and determining the procedures for collecting and analyzing data. The experimental design should be based on the research question and the hypothesis, and it should allow for the manipulation of the independent variable and the measurement of the dependent variable.

    Step 5: Conduct a pilot study

    Before conducting the main experiment, it is a good idea to conduct a pilot study. A pilot study is a small-scale version of the experiment that is used to test the procedures and ensure that the data collection and analysis methods are sound. The results of the pilot study can be used to refine the experimental design and make any necessary adjustments.

    Step 6: Collect and analyze data

    Once the experiment is set up, data collection can begin. It is essential to follow the procedures defined in the experimental design and collect data in a systematic and consistent manner. Once the data is collected, it must be analyzed to test the hypothesis and answer the research question.

    Step 7: Draw conclusions and report results

    The final step in setting up an experiment is to draw conclusions and report the results. The data should be analyzed to determine whether the hypothesis was supported or rejected, and the results should be reported in a clear and concise manner. The conclusions should be based on the evidence collected and should be supported by statistical analysis and a discussion of the limitations and implications of the study.

  • Cross Sectional Design

    how to set up a cross-sectional design in quantitative research in a media-related context:

    Research Question: What is the relationship between social media use and body image satisfaction among teenage girls?

    1. Define the research question: Determine the research question that the study will address. The research question should be clear, specific, and measurable.
    2. Select the study population: Identify the population that the study will target. The population should be clearly defined and include specific demographic characteristics. For example, the population might be teenage girls aged 13-18 who use social media.
    3. Choose the sampling strategy: Determine the sampling strategy that will be used to select the study participants. The sampling strategy should be appropriate for the study population and research question. For example, you might use a stratified random sampling strategy to select a representative sample of teenage girls from different schools in a specific geographic area.
    4. Select the data collection methods: Choose the data collection methods that will be used to collect the data. The methods should be appropriate for the research question and study population. For example, you might use a self-administered questionnaire to collect data on social media use and body image satisfaction.
    5. Develop the survey instrument: Develop the survey instrument based on the research question and data collection methods. The survey instrument should be valid and reliable, and include questions that are relevant to the research question. For example, you might develop a questionnaire that includes questions about the frequency and duration of social media use, as well as questions about body image satisfaction.
    6. Collect the data: Administer the survey instrument to the study participants and collect the data. Ensure that the data is collected in a standardized manner to minimize measurement error.
    7. Analyze the data: Analyze the data using appropriate statistical methods to answer the research question. For example, you might use correlation analysis to examine the relationship between social media use and body image satisfaction.
    8. Interpret the results: Interpret the results and draw conclusions based on the findings. The conclusions should be based on the data and the limitations of the study. For example, you might conclude that there is a significant negative correlation between social media use and body image satisfaction among teenage girls, but that further research is needed to explore the causal mechanisms behind this relationship.