-
Building your Research Instrument 3
Research instruments serve a critical function across all types of research methods. They are the primary means by which researchers collect reliable data that will later be analyzed. As noted by scholars in the field, these instruments are essential for maintaining the integrity and credibility of research findings.
The choice and design of your research instrument directly impact the quality of data you collect. Poor instrument design can lead to biased results, misunderstood questions, low response rates, or data that doesn’t actually address your research questions. Conversely, a well-designed instrument facilitates smooth data collection and produces information that genuinely advances understanding in your field.
Real-World Application: A Social Media Research Example
To illustrate how research instruments work in practice, consider a recent field experiment examining toxic content on social media platforms. Researchers studied 742 users over six weeks across Facebook, X (formerly Twitter), and YouTube to understand how toxic content affects user engagement.
The research revealed a paradox: less toxic content actually led to lower engagement rates. Users switched to other platforms when exposed to less toxic content, and overall, posts became less toxic during the study period. This finding highlights an important conflict that platforms face between maximizing profits through engagement and promoting user wellbeing.
This study demonstrates several key principles of good instrument design. The researchers needed instruments that could accurately measure “toxicity” in content, track user engagement across multiple metrics, and account for variables like platform differences and time spent on site. Their instrument design had to operationalize abstract concepts (like “toxic content”) into measurable variables while maintaining validity across different social media environments.
Practical Considerations for Instrument Development When developing your own research instrument, keep these practical considerations in mind:
Start with existing instruments – Don’t reinvent the wheel. Many validated instruments already exist for common research topics. You can adapt these to your context, which saves time and leverages established validity and reliability.
Pilot test thoroughly – Before deploying your instrument widely, test it with a small sample. This helps identify confusing questions, technical problems, or unexpected response patterns.
Consider your sample – Design your instrument with your target population in mind. Reading level, cultural references, question length, and format should all be appropriate for your respondents.
Plan for analysis – Think ahead to how you’ll analyze your data. The structure of your questions should facilitate the analytical techniques you plan to use.
Balance comprehensiveness with brevity – While you want to gather sufficient data, overly long instruments lead to respondent fatigue and lower quality responses.
Ensure ethical compliance – Your instrument should respect respondent privacy, obtain proper consent, and avoid questions that could cause psychological harm.
Research instruments are far more than simple data collection tools—they’re carefully designed mechanisms that transform abstract research questions into concrete, analyzable information.
Whether you’re developing a questionnaire to assess student satisfaction, a test to measure learning outcomes, or an observational checklist for behavioral research, the principles remain the same: your instrument must be valid, reliable, theoretically grounded, and appropriate for your research context.
The eight-step development process provides a roadmap, but remember that instrument development is often iterative. You may need to cycle back through earlier steps as you refine your understanding of the topic and clarify your research questions. The effort invested in developing a strong research instrument pays dividends throughout your study, from smoother data collection to more credible findings.
-
Building your Research Instrument 1
The tools we use to gather data can make or break a study. Research instruments serve as the bridge between theoretical concepts and empirical evidence, allowing researchers to collect, measure, and analyze data systematically. Understanding how to develop and deploy these instruments effectively is crucial for anyone embarking on quantitative research.
What Are Research Instruments?
A research instrument is essentially a tool used to collect, measure, and analyze data related to your research subject. These can take various forms including tests, surveys, scales, questionnaires, or even checklists. The choice of instrument depends entirely on your research objectives and the nature of the data you need to collect.
According to recent academic guidance, the two most commonly used research instruments in quantitative studies are questionnaires and tests. What makes these instruments valuable isn’t just their ability to gather data, but their capacity to do so in ways that are both valid and reliable.
The Foundation: Validity and Reliability
Reliability concerns the consistency of your measurements. If you were to administer the same instrument multiple times under similar conditions, would you get similar results? A reliable instrument produces stable, consistent measurements.
Validity refers to the degree to which an instrument measures what it purports to measure. In other words, does your questionnaire actually capture the information about attitudes, behaviors, or characteristics that you’re trying to study? A valid instrument ensures that you’re measuring the right thing.
These two qualities aren’t just academic niceties—they’re essential for ensuring that your research findings are trustworthy and meaningful.
Types of Research Instruments
Survey Research
Survey research encompasses any measurement procedures that involve asking questions of respondents. Surveys are remarkably versatile and can be adapted to various research contexts. They can vary in the timeframe they cover:
Cross-sectional surveys capture data at a single point in time, providing a snapshot of current conditions Longitudinal surveys track changes over extended periods, revealing patterns and trends ,
Within surveys, you’ll encounter different types of questions:Free-Answer Questions (also called open-ended questions) allow respondents to provide unrestricted, essay-style responses. These offer rich, detailed data but can be challenging to analyze systematically.
Guided Response Type Questions include recall-type questions asking participants to remember specific information, as well as multiple-choice or multiple response questions. These provide structured data that’s easier to quantify and analyze statistically.
Other Quantitative Instruments
Beyond surveys, quantitative research employs various other instruments depending on the research context. These include standardized tests, observational checklists, physiological measurement devices, and experimental protocols. The key is selecting the instrument that best aligns with your research questions and methodology.
-
Building your Research Instrument 2
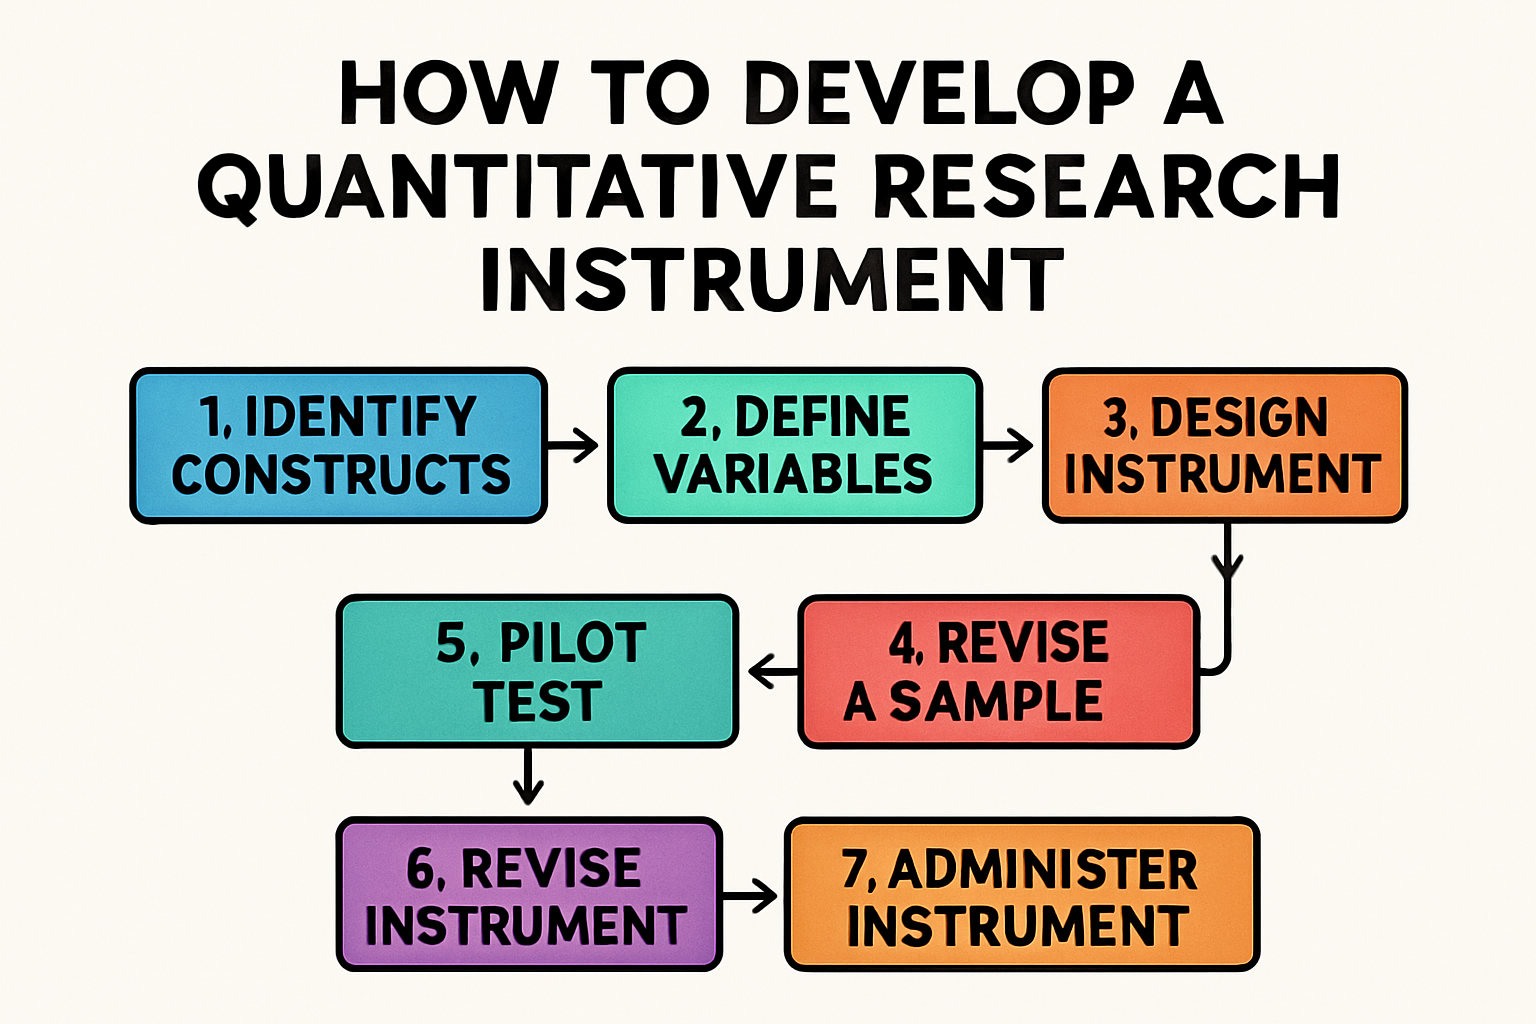
How to Develop a Research Instrument: An Eight-Step Process
1. Select a Topic
Begin with a clear understanding of what you want to study. Your topic should be focused enough to be manageable but broad enough to be meaningful.2. Formulate a Thesis Statement
Develop a preliminary statement about what you expect to find or the relationship you want to investigate.3. Choose the Types of Analyses
Determine what statistical or analytical methods you’ll use to examine your data. This decision influences the type of data you need to collect.4. Research and Write a Literature Review; Refine the Thesis
Examine existing research in your area. This helps you understand what’s already known, identifies gaps, and allows you to refine your initial thesis based on current knowledge.5. Formulate Research Objectives and Questions
Translate your refined thesis into specific, answerable research questions that will guide your instrument development.6. Conceptualize a Topic
Identify the key concepts and variables you need to measure. This conceptual framework becomes the foundation of your instrument.7. Choose Research Method and the Research Instrument
Based on your research questions and the nature of your variables, select the most appropriate method and instrument type.8. Operationalize Concepts and Construct the Instrument
Transform abstract concepts into concrete, measurable questions or items. This is where your conceptual framework becomes a practical tool for data collection. -
Understanding the Power of Z-Scores in Data Analysis: Why Standardization Matters in Media Research
Introduction
In data analysis, especially within the social and media sciences, researchers often confront datasets composed of variables that operate on entirely different scales. Audience reach may be expressed in millions of viewers, engagement rates in percentages, and emotional responses in numerical ratings from survey scales. Comparing or combining such variables without a common frame of reference can lead to misleading interpretations. One of the most powerful statistical techniques to address this challenge is standardization through z-scores.
Z-scores, sometimes referred to as standard scores, transform raw data into a standardized metric indicating how far and in which direction a data point deviates from its distribution’s mean, measured in units of standard deviation (Field, 2021). This transformation not only allows for direct comparability between different datasets but also forms the foundation for a broad range of statistical analyses, including correlation, regression, and hypothesis testing.
This blog post explains the conceptual basis of z-scores, discusses their analytical advantages, and illustrates their use with an example drawn from media studies research — specifically, audience engagement analysis across multiple social media platforms.
The Concept of Z-Scores
At its core, the z-score represents the position of an observation within a distribution. It is computed as:
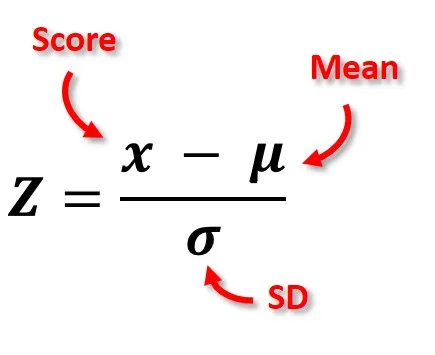
where X is the observed value, \mu the mean of the distribution, and sigma the standard deviation (Gravetter & Wallnau, 2020).
This transformation re-expresses data so that the new distribution has a mean of 0 and a standard deviation of 1. In other words, after standardization, all variables — regardless of their original units — share a common scale.
A positive z-score indicates a value above the mean, a negative one indicates a value below the mean, and the absolute magnitude reflects how far away it lies in terms of standard deviations. For example, a z-score of +2 means that a score is two standard deviations above the mean, placing it among the top 2.5% of the distribution in a normal curve.
This statistical simplicity hides a profound conceptual advantage: z-scores make contextual interpretation possible even across variables that originally had no meaningful comparison.
Why Standardization Matters in Data Analysis
The need for standardization becomes evident when data variables differ in units, ranges, or variance. Without standardization, large-scale variables may dominate smaller-scale ones in multivariate analysis, leading to distorted or biased outcomes (Tabachnick & Fidell, 2019).
For instance, imagine a dataset containing both “average viewing time in minutes” and “viewer satisfaction on a 1–10 scale.” The raw scales are incomparable: a one-unit increase in minutes does not equate to a one-unit increase in satisfaction. Z-scores solve this by eliminating units and expressing both variables relative to their means and variances.
In this standardized form, each data point reflects its relative position within its own distribution, allowing direct comparison and the integration of heterogeneous data into a single analytical framework.
Advantages of Using Z-Scores
1. Comparability Across Different Metrics
The primary advantage of z-scores is that they allow researchers to compare values that come from different scales or even different populations. For example, in media analytics, engagement data on TikTok, YouTube, and Instagram may have vastly different average interaction levels and variances. A z-score transformation allows analysts to compare relative performance rather than raw numbers.
This comparability is essential in contexts such as cross-platform performance evaluation, where absolute metrics (likes, shares, views) are less meaningful than standardized deviations from each platform’s average engagement (Keller, 2022).
2. Identification of Outliers
Z-scores provide a direct method for detecting outliers — data points that lie far from the mean. In standardized data, scores beyond ±3 are typically considered unusual or extreme. Identifying such points is crucial in data cleaning, error detection, or when investigating exceptional cases (e.g., a viral post that greatly exceeds normal engagement).
3. Facilitating Normal Distribution Analysis
Many inferential statistical techniques assume normality. By converting variables to z-scores, researchers can map data directly onto the standard normal distribution, enabling straightforward calculation of probabilities and percentiles. This property is foundational for hypothesis testing, confidence intervals, and determining statistical significance.
4. Enhancing Regression and Machine Learning Models
In multivariate contexts such as regression or machine learning, z-scores improve numerical stability and interpretability. Standardizing predictors ensures that coefficients represent comparable scales of effect and that optimization algorithms converge efficiently (James, Witten, Hastie, & Tibshirani, 2023).
5. Equity and Interpretability in Media Analytics
In media and communication research, comparing channels or audience segments often involves balancing variables that are inherently unequal — follower counts, impressions, or content types. Z-scores provide an equitable framework that translates these into a shared metric, reducing bias and improving interpretability when communicating findings to non-technical stakeholders.
A Media-Related Example: Comparing Engagement Across Platforms
To illustrate, consider a media researcher analyzing the engagement performance of short-form videos posted by a news organization across three platforms: TikTok, Instagram Reels, and YouTube Shorts. The goal is to identify which platform generates the strongest audience engagement relative to each platform’s own norms.
Step 1: Collecting Data
Suppose the researcher gathers the following metrics for each video:
- Views (in thousands)
- Likes (count)
- Average watch duration (in seconds)
Raw data from these platforms are not directly comparable: TikTok typically yields higher view counts but shorter watch durations; YouTube has fewer views but longer engagement times.
Step 2: Standardizing with Z-Scores
To make comparisons meaningful, the researcher computes z-scores for each metric within each platform. The resulting z-score represents how a particular video performs relative to the average video on that platform.
For instance:
- A TikTok video with a z-score of +2.1 in likes means it performs significantly better than most TikTok videos.
- An Instagram video with a z-score of −1.2 in watch duration performs worse than average for Instagram.
After standardization, the researcher can combine these standardized metrics into a composite engagement index (e.g., by averaging z-scores across metrics).
Step 3: Interpreting the Results
This analysis reveals which videos are relatively strong performers within their own platforms and which outperform expectations across platforms. A video that achieves high positive z-scores consistently across all platforms can be considered universally engaging content, while one with platform-specific success might reveal contextual audience preferences.
This z-score-based approach thus supports comparative analysis without distorting scale differences, allowing researchers to draw fairer and more interpretable conclusions about cross-platform media performance.
The Broader Implications for Media and Communication Research
Z-scores are not merely a statistical convenience; they represent a methodological principle of contextual equivalence. Media scholars increasingly encounter “big data” environments where metrics are heterogeneous — likes, retweets, view durations, or sentiment scores all coexist within complex datasets (Napoli, 2019). Standardization through z-scores enables a coherent analytical language that makes such multidimensional data tractable.
Moreover, z-scores align with the epistemological goals of media research: understanding relative phenomena rather than absolute quantities. Engagement, influence, or attention are inherently comparative constructs — one post garners “more” engagement than another, one influencer performs “better” than peers. Standardization captures these relational dimensions quantitatively, reflecting the comparative nature of media dynamics.
From a pedagogical perspective, introducing z-scores early in statistical education helps students move beyond rote computation toward conceptual reasoning. It reinforces the idea that statistical meaning emerges from context — that a raw score’s value is inseparable from the distribution to which it belongs.
Z-Scores and Inferential Statistics
The utility of z-scores extends beyond descriptive analysis into inferential statistics. When a population is normally distributed, z-scores directly correspond to probabilities:
- A z-score of 0 corresponds to the 50th percentile.
- A z-score of +1 corresponds to approximately the 84th percentile.
- A z-score of −1 corresponds to approximately the 16th percentile.
This mapping allows researchers to test hypotheses about sample means or individual observations relative to population expectations. In media research, this might involve testing whether an advertisement’s recall score significantly exceeds the industry average, or whether a specific campaign’s engagement lies within the expected variability range.
For example, if the mean engagement rate for online news videos is 3.5% (SD = 1.2%), and a specific video achieves 6%, its z-score would be:
z = \frac{6 – 3.5}{1.2} = 2.08
This result places the video above 98% of all comparable content — an easily interpretable, probabilistic statement grounded in the standard normal distribution.
Integrating Z-Scores with Modern Data Analysis Techniques
In modern analytics environments — including data dashboards, AI-based recommendation systems, and predictive modeling — z-scores remain foundational. Many machine learning algorithms implicitly rely on feature standardization to ensure balanced weighting among input variables. For example, in sentiment analysis of user comments, standardizing word frequency scores ensures that no individual feature dominates due to scale differences.
In media analytics platforms, z-scores can enhance dashboards by visualizing relative performance rather than raw values. A chart showing z-scores of engagement or sentiment provides an intuitive signal of whether a piece of content performs “above average,” “average,” or “below average,” independent of platform-specific scale effects.
This relative framing aligns with how human audiences interpret performance: people understand “better than average” more naturally than “5.3% engagement.” Thus, z-scores bridge quantitative rigor with interpretive clarity — a rare combination valuable for both researchers and practitioners.
Limitations and Responsible Use
While z-scores are powerful, they must be applied carefully. They assume underlying distributions that are roughly normal; in heavily skewed or bounded data (common in media analytics, such as likes or views), extreme values can distort the mean and standard deviation. In such cases, researchers may use robust standardization or transform data (e.g., via logarithms) before computing z-scores (Field, 2021).
Additionally, z-scores provide relative interpretation — they describe how unusual a score is within its distribution but not why. A high z-score in engagement could stem from a viral event, algorithmic amplification, or data errors. Thus, z-scores should be treated as diagnostic tools, guiding deeper interpretation rather than providing definitive explanations.
Educational Perspective: Teaching Z-Scores in Media Studies
For students in media and communication programs, understanding z-scores is a gateway to quantitative literacy. The concept concretely illustrates statistical reasoning about variation and context. Teaching z-scores through media examples — such as analyzing differences in follower counts or video retention rates — connects abstract mathematics to real-world interpretation.
In classrooms, visualizing z-scores on a standard normal curve helps students intuitively grasp the meaning of “above average” or “two standard deviations below.” Incorporating practical assignments where students standardize social media metrics encourages them to think critically about comparability, fairness, and statistical bias — essential competencies in contemporary media research.
References
Field, A. (2021). Discovering statistics using IBM SPSS statistics (6th ed.). Sage Publications.
Gravetter, F. J., & Wallnau, L. B. (2020). Statistics for the behavioral sciences (11th ed.). Cengage Learning.
James, G., Witten, D., Hastie, T., & Tibshirani, R. (2023). An introduction to statistical learning: With applications in R (3rd ed.). Springer.
Keller, M. (2022). Cross-platform analytics in digital media research. Routledge.
Napoli, P. M. (2019). Social media and the public interest: Media regulation in the disinformation age. Columbia University Press.
Tabachnick, B. G., & Fidell, L. S. (2019). Using multivariate statistics (7th ed.). Pearson.
-
Comscore
Comscore
Comscore, Inc. is a leading global media measurement and analytics company that provides marketing data and insights to enterprises across various platforms. Founded in July 1999 in Reston, Virginia, Comscore has evolved into a key player in the media measurement industry.
Key Services and Features
Comscore offers a range of services and features that help businesses understand and analyze audience behavior:
1. Audience Measurement: Comscore tracks reach and frequency, providing insights into how many unique users interact with content and how often.
2. Demographic Insights: The company offers detailed demographic data, including age, gender, income, and education level of audiences.
3. Cross-Platform Analytics: Comscore measures audience behavior across multiple platforms, including desktops, mobiles, tablets, and connected TVs (CTV).
4. Engagement Metrics: Beyond basic metrics, Comscore analyzes user behavior such as clicks, scrolls, and social media shares.
5. Path to Conversion: The company tracks the journey users take before making a purchase or taking a desired action.Recent Developments
In January 2025, Comscore launched a new cross-platform solution called Comscore Content Measurement (CCM) within The Comscore Platform. This unified content measurement solution provides content owners and creators with self-service access to media measurement tools across various platforms, including linear TV, CTV/Streaming, PC, Mobile, and Social -
Is Correlation the same as Causation?
📺 Correlation and Causation in Media Studies
When studying media, we often hear claims like:
- “Watching violent movies makes people more aggressive.”
- “Using social media causes anxiety in teenagers.”
- “People who follow political news are better informed.”
- This list goes on……
What “correlation” means in media research
In media studies, correlation refers to a measurable relationship between two variables.
For example:
- The more time people spend on TikTok, the lower their reported attention span.
- People who watch political satire also tend to vote more often.
A correlation means these things move together — not that one makes the other happen.
In practice, we often visualize correlations through surveys and audience data:
if you plot time spent on social media (x-axis) and reported stress (y-axis), and the dots trend upward, there’s a positive correlation. But all that means is: they co-occur.
What “causation” means in media research
Causation is the stronger claim: one variable directly affects the other.
For instance, to say “Social media use causes anxiety” means that increasing someone’s time online would make them more anxious, even if nothing else changed.
Proving causation requires evidence of a mechanism (how one influences the other) and control (ruling out other possible explanations). In media studies, this is often difficult, because people’s media use is voluntary and shaped by many factors like personality, social context, and culture.
Why media scholars keep mixing them up
The media world is full of patterns and data — likes, shares, views, and surveys.
So it’s tempting to draw quick causal conclusions:
Correlation Tempting (but wrong) causal leap People who post more selfies report lower self-esteem. “Posting selfies causes insecurity.” Students who multitask with TV have lower grades. “Watching TV while studying makes you dumb.” Countries with more broadband access have higher political participation. “The internet makes people more democratic.” Each of these could be true, but each could also have confounding variables:
- Maybe insecure people use selfies to seek validation (reverse causation).
- Maybe busy or stressed students both multitask and have lower grades (third variable).
- Maybe democracies invest in broadband because they already value participation (reverse direction).
Classic examples from media studies
1. Violence in the media
Decades of research have found correlations between violent media content and aggressive thoughts or behaviors. But causation remains controversial.
Do violent movies cause aggression? Or do already aggressive individuals choose violent media?
Experimental studies can test short-term effects (e.g., aggression in lab games), but real-world causation is far more complex.
2. Social media and mental health
Numerous studies find a correlation between heavy social media use and increased depression or anxiety. Yet causation isn’t clear.
It could be that social media contributes to these feelings — but it could also be that anxious individuals spend more time online for distraction or connection.
3. Media exposure and political polarization
News echo chambers correlate with more extreme attitudes. But we don’t yet know whether selective exposure causes polarization, or whether already polarized individuals choose like-minded news sources.
How media researchers handle the problem
Media scholars use several strategies to move from correlation toward causal insight:
- Experiments: expose one group to a media stimulus (e.g., a political ad) and another to a neutral message, then measure differences in attitude.
- Longitudinal studies: follow the same participants over time to see if changes in media use precede changes in behavior.
- Content analysis + surveys: compare patterns in media texts with audience perceptions, testing whether exposure predicts responses after controlling for other factors.
- Natural experiments: use real-world changes (e.g., a new platform launch, algorithm shift, or policy ban) as “interventions” to test causal impacts.
These designs don’t make causation certain, but they strengthen the evidence and help researchers narrow the gap between correlation and causation.
Thinking like a media researcher
When you encounter a media headline —
“New study proves Instagram harms body image”
— pause and ask:
- What exactly was measured? (self-reports, behavior, or both?)
- Were other variables controlled? (age, personality, cultural context?)
- Could the relationship work the other way around?
- Was this an experiment, a survey, or an observation?
You’ll start noticing that many media stories about “effects” are based on correlational data that suggest association, not proof of cause.
-
Suspense
Suspense is a powerful emotional reaction that media students should be familiar with. It is a feeling of uncertainty, anticipation, and tension that builds up as the audience waits for the outcome of an event. According to Gerrig and Zimbardo (2018), “suspense is a cognitive and emotional experience that arises from the audience’s awareness of an impending outcome that is uncertain and potentially significant” (p. 278).
Suspense is often used in films, television shows, and literature to engage the audience and create a sense of excitement. It can be created through various techniques, such as music, camera angles, and pacing. For example, in Alfred Hitchcock’s film “Psycho,” the famous shower scene is shot in quick, jarring cuts that create a sense of chaos and uncertainty, which heightens the suspense.
In addition, suspense can be enhanced by the use of foreshadowing. Foreshadowing is a technique that hints at future events, which can increase the audience’s anticipation and sense of unease. For example, in the television series “Breaking Bad,” there are numerous instances of foreshadowing, such as the use of the color green to symbolize death, which creates a sense of dread and anticipation in the audience.
Suspense is an effective tool for media creators because it keeps the audience engaged and interested in the story. It can also elicit a strong emotional response from the audience, as they become invested in the outcome of the story. As Gerrig and Zimbardo (2018) note, “suspenseful stories tap into deep-seated human needs for arousal, uncertainty, and social connection, and they can provide a powerful emotional experience that leaves a lasting impression on the viewer or reader” (p. 279).
In conclusion, suspense is an important emotional reaction for media students to understand. It is a feeling of uncertainty, anticipation, and tension that is created through various techniques, such as music, camera angles, pacing, and foreshadowing. Suspense is an effective tool for media creators to engage and emotionally connect with their audiences, and it can leave a lasting impression on the viewer or reader.
References:
Gerrig, R., & Zimbardo, P. (2018). Psychology and life (21st ed.). Pearson.
-
Curiosity
Curiosity is a complex and powerful emotional reaction that filmmakers often aim to elicit in their audiences. Various techniques and effects can create curiosity in film, engaging viewers in the story and keeping them invested in it. This essay discusses some of the effects that can create curiosity in film.
One of the most effective ways to create curiosity in film is to use suspense. Suspense involves delaying the resolution of a particular situation, creating a sense of tension and anticipation in the audience. Alfred Hitchcock was a master of this technique, and his films such as “Psycho” and “Vertigo” are filled with moments of suspense that keep viewers on the edge of their seats (Deutelbaum & Poague, 2011). In “Psycho”, the shower scene is filled with suspense as the audience knows that the killer is in the bathroom, but Marion does not. The use of suspense in this scene creates a sense of curiosity in the audience as they wait to see what will happen next.
Another technique that can create curiosity in film is to use mystery. Mystery involves presenting the audience with a puzzle or a question that needs to be solved. This can be achieved through the use of enigmatic characters, strange events, or unexplained phenomena. David Lynch’s “Mulholland Drive” is an example of a film that uses mystery to create curiosity. The film is filled with cryptic clues and unexplained events that keep viewers guessing as to what is really going on (Gibson, 2016). The use of mystery in this film creates a sense of curiosity in the audience as they try to unravel the secrets of the story.
Ambiguity is another technique that can create curiosity in film. Ambiguity involves presenting the audience with a situation or a character that is not clearly defined. This can be achieved through the use of unclear motives, conflicting emotions, or contradictory actions. Christopher Nolan’s “Inception” is an example of a film that uses ambiguity to create curiosity. The film is filled with complex and layered characters, each with their own motivations and desires. The use of ambiguity in this film creates a sense of curiosity in the audience as they try to understand the true nature of the story (Nolan, 2010).
The unexpected is another technique that can create curiosity in film. The unexpected involves presenting the audience with a surprise or a twist that they were not expecting. This can be achieved through the use of unexpected events, unexpected character actions, or unexpected plot twists. M. Night Shyamalan’s “The Sixth Sense” is an example of a film that uses the unexpected to create curiosity. The film has a twist ending that completely changes the audience’s perception of the story, creating a sense of curiosity in the audience as they try to figure out how they missed the clues (Ebert, 1999).
In addition to these techniques, there are other factors that can create curiosity as an emotional reaction in film. The use of music is one such factor. Music can set the tone for a scene, create a sense of tension or anticipation, and add emotional depth to the story. John Williams’ theme music in “Jaws” creates a sense of dread and anticipation in the audience, building up to the appearance of the shark (Sider, Freeman, & Sider, 2013). The use of music in this film creates a sense of curiosity in the audience as they wait to see what will happen next.
Visual effects are another factor that can create curiosity in film. Visual effects can be used to create a sense of awe, wonder, or excitement in the audience. In “Avatar”, James Cameron used visual effects to create the stunning world of Pandora, immersing the audience in a world unlike anything they had seen before (Prince, 2013).The
use of visual effects in this film creates a sense of curiosity in the audience as they explore this new and unfamiliar world.
Finally, the use of pacing can also create curiosity in film. Pacing involves the speed and rhythm at which the story is told, and it can be used to create a sense of tension and anticipation in the audience. Steven Spielberg’s “Jurassic Park” is an example of a film that uses pacing to create curiosity. The film starts off slowly, introducing the characters and the setting, but as the story progresses, the pace quickens, building up to the climactic finale (Young, 2000). The use of pacing in this film creates a sense of curiosity in the audience as they wait to see how the story will unfold.
In conclusion, there are many techniques and effects that can create curiosity as an emotional reaction in film. Suspense, mystery, ambiguity, the unexpected, music, visual effects, and pacing are just some of the ways that filmmakers can engage their audiences and keep them invested in the story. By understanding how these techniques and effects work, filmmakers can create films that are not only entertaining but also emotionally engaging and thought-provoking.
References:
Deutelbaum, M. & Poague, L. (2011). A Hitchcock reader. John Wiley & Sons.
Ebert, R. (1999). The Sixth Sense. Roger Ebert. https://www.rogerebert.com/reviews/the-sixth-sense-1999
Gibson, S. (2016). Mulholland Drive. Harvard Film Archive. https://harvardfilmarchive.org/calendar/mulholland-drive-2016-04
Nolan, C. (2010). Inception. Warner Bros. Pictures.
Prince, S. (2013). Digital visual effects in cinema: The seduction of reality. Rutgers University Press.
Sider, L., Freeman, D., & Sider, J. (2013). Soundscape and soundtrack. John Wiley & Sons.
Young, B. (2000). Jurassic Park. Universal Pictures.
-
Brand Luxury Scale
The Brand Luxury Index (BLI) is a tool designed to measure consumers’ perceptions of luxury brands[1]. Developed by researchers Jean-Noël Kapferer and Vincent Bastien, the BLI assesses various aspects of a brand’s luxury status through seven sub-categories[1].
Components of the BLI
The BLI consists of seven key dimensions:
- Price
- Aesthetics
- Exclusivity
- Client Relationship
- Social Status
- Hedonism
- Quality
Each dimension is scored on a scale of 0-10, with a total possible score of 70[1].
Scoring and Interpretation
The scoring rules vary slightly for different sub-categories:
- For most sub-categories, higher scores indicate higher levels of luxury[1].
- The Client Relationship category is reverse-scored, where lower scores indicate higher luxury[1].
Survey Questions
The BLI survey includes questions for each dimension. Here are some example statements for each category:
Price
- The brand’s products are highly priced.
- The brand’s pricing reflects its exclusivity.
Aesthetics
- The brand’s products are visually appealing.
- The brand’s designs are aesthetically pleasing.
Exclusivity
- The brand’s products are not easily accessible to everyone.
- Owning this brand’s products makes me feel unique.
Client Relationship
- The brand provides excellent customer service.
- The brand has a personal connection with its customers.
Social Status
- Owning a product from this brand is a status symbol.
- The brand is associated with high social status and prestige.
Hedonism
- The brand’s products provide a luxurious and indulgent experience.
- Owning a product from this brand is a form of self-indulgence.
Quality
- The brand’s products are of exceptional quality.
- The brand uses the best materials and craftsmanship[1].
Criticisms and Limitations
Despite its widespread use, the BLI has faced some criticism:
- Subjectivity: The scale relies heavily on consumer perceptions, which can be subjective[1].
- Lack of objective measures: It does not account for tangible aspects of luxury such as materials or craftsmanship[1].
- Limited applicability: Some researchers argue that the BLI may not be suitable for all luxury brands, as different brands may prioritize different aspects of luxury[1].
Revisions and Improvements
Recognizing these limitations, researchers have proposed modifications to the original BLI. Kim and Johnson developed a revised version with five dimensions: quality, extended-self, hedonism, accessibility, and tradition[2]. This modified BLI aims to provide a more practical tool for assessing consumer perceptions of brand luxury[2].
Conclusion
The Brand Luxury Index Scale remains a valuable tool for measuring consumer perceptions of luxury brands. While it has limitations, ongoing research and revisions continue to improve its effectiveness and applicability in the ever-evolving luxury market.
Citations:
[1] https://researchmethods.imem.nl/CB/index.php/research/concept-scales-and-quationaires/123-brand-luxury-index-scale-bli
[2] https://www.emerald.com/insight/content/doi/10.1108/JFMM-05-2015-0043/full/html
[3] https://premierdissertations.com/luxury-marketing-and-branding-an-evaluation-under-bli-brand-luxury-index/
[4] https://www.proquest.com/docview/232489076
[5] https://www.researchgate.net/publication/247478622_Measuring_perceived_brand_luxury_An_evaluation_of_the_BLI_scale
[6] https://www.researchgate.net/publication/31968013_Measuring_perceptions_of_brand_luxury
[7] https://www.deepdyve.com/lp/emerald-publishing/brand-luxury-index-a-reconsideration-and-revision-dOTwPEUCxt -
Brand Parity Scale
Brand parity is a phenomenon where consumers perceive multiple brands in a product category as similar or interchangeable[1]. This concept has significant implications for marketing strategies and consumer behavior. To measure brand parity, researchers have developed scales to quantify consumers’ perceptions of brand similarity.
The Brand Parity Scale
James A. Muncy developed a multi-item scale to measure perceived brand parity for consumer nondurable goods[3]. This scale has been widely used in marketing research to assess the level of perceived similarity among brands in a given product category.
Scale Components
The Brand Parity Scale typically includes items that assess various aspects of brand similarity, such as:
- Perceived quality differences
- Functional equivalence
- Brand interchangeability
- Uniqueness of brand features
Survey Questions
While the exact questions from Muncy’s original scale are not provided in the search results, typical items on a brand parity scale might include:
- “The quality of most brands in this product category is basically the same.”
- “I can’t tell the difference between the major brands in this category.”
- “Most brands in this category are essentially identical.”
- “Switching between brands in this category makes little difference.”
- “The features offered by different brands in this category are very similar.”
Respondents usually rate these statements on a Likert scale, ranging from “Strongly Disagree” to “Strongly Agree.”
Impact of Brand Parity
High levels of perceived brand parity can have significant effects on consumer behavior and brand management:
- Reduced Brand Loyalty: When consumers perceive brands as similar, they are less likely to develop strong brand loyalty[4].
- Increased Price Sensitivity: Brand parity can lead to greater price sensitivity among consumers, as they may not see added value in paying more for a particular brand[1].
- Diminished Marketing Effectiveness: High brand parity can make it challenging for brands to differentiate themselves through marketing efforts[1].
- Impact on Repurchase Intention: Brand parity can moderate the relationship between brand-related factors (such as brand image and brand experience) and consumers’ repurchase intentions[2].
Critiques and Limitations
While Muncy’s Brand Parity Scale has been widely used, it has also faced some critiques:
- Context Specificity: The scale may need to be adapted for different product categories or markets[8].
- Evolving Consumer Perceptions: As markets change, the relevance of specific scale items may need to be reassessed[8].
- Cultural Differences: The scale may not account for cultural variations in brand perceptions across different regions or countries.
Conclusion
The Brand Parity Scale provides a valuable tool for marketers to assess the level of perceived similarity among brands in a product category. By understanding the degree of brand parity, companies can develop more effective strategies to differentiate their brands and create unique value propositions. As markets continue to evolve, ongoing research and refinement of brand parity measurement tools will be crucial for maintaining their relevance and effectiveness in guiding marketing decisions.
Citations:
[1] https://www.haveignition.com/what-is-gtm/the-go-to-market-dictionary-brand-parity
[2] https://www.abacademies.org/articles/impact-of-brand-parity-on-brandrelated-factors-customer-satisfaction-repurchase-intention-continuum-an-empirical-study-on-brands-o-13401.html
[3] https://openurl.ebsco.com/contentitem/gcd:83431944?crl=f&id=ebsco%3Agcd%3A83431944&sid=ebsco%3Aplink%3Ascholar
[4] https://www.researchgate.net/publication/4733786_The_Role_of_Brand_Parity_in_Developing_Loyal_Customers
[5] https://www.degruyter.com/document/doi/10.1515/econ-2022-0054/html?lang=en
[6] https://researchmethods.imem.nl/CB/index.php/research/concept-scales-and-quationaires/137-brand-perception-scale
[7] https://www.researchgate.net/publication/270158684_Differentiated_brand_experience_in_brand_parity_through_branded_branding_strategy
[8] https://www.europub.co.uk/articles/perceived-brand-parity-critiques-on-muncys-scale-A-5584 -
Brand Experience Scale
The Brand Experience Scale, developed by Brakus, Schmitt, and Zarantonello in 2009, is a significant contribution to the field of marketing and brand management. This scale provides a comprehensive framework for measuring and understanding how consumers experience brands across multiple dimensions.
Conceptualization of Brand Experience
Brand experience is defined as the sensations, feelings, cognitions, and behavioral responses evoked by brand-related stimuli[1][3]. These stimuli can include a brand’s design, identity, packaging, communications, and environments. The concept goes beyond traditional brand measures, focusing on the subjective, internal consumer responses to brand interactions.
Dimensions of Brand Experience
The Brand Experience Scale comprises four key dimensions:
- Sensory: How the brand appeals to the five senses
- Affective: Emotions and feelings evoked by the brand
- Intellectual: The brand’s ability to engage consumers in cognitive and creative thinking
- Behavioral: Physical actions and behaviors induced by the brand
Scale Development and Validation
The authors conducted six studies to develop and validate the Brand Experience Scale[3]. They began with a large pool of items, which were then refined through exploratory factor analysis. The final scale was validated using confirmatory factor analysis and structural equation modeling.
Importance and Applications
The Brand Experience Scale offers several advantages:
- Reliability and validity: The scale has demonstrated strong psychometric properties across multiple studies[1][3].
- Distinctiveness: It is distinct from other brand measures such as brand evaluations, involvement, and personality[2].
- Predictive power: Brand experience has been shown to affect consumer satisfaction and loyalty both directly and indirectly[3].
Implications for Marketing Practice
Marketers can use the Brand Experience Scale to:
- Assess the effectiveness of brand-related stimuli
- Compare brand experiences across different products or services
- Identify areas for improvement in brand strategy
- Predict consumer behavior and loyalty
Brand Experience Questionnaire
The following is the Brand Experience Scale questionnaire, using a 7-point Likert scale (1 = strongly disagree, 7 = strongly agree)[3]:
Sensory Dimension:
- This brand makes a strong impression on my visual sense or other senses.
- I find this brand interesting in a sensory way.
- This brand does not appeal to my senses.
Affective Dimension:
- This brand induces feelings and sentiments.
- I do not have strong emotions for this brand.
- This brand is an emotional brand.
Intellectual Dimension:
- I engage in a lot of thinking when I encounter this brand.
- This brand does not make me think.
- This brand stimulates my curiosity and problem solving.
Behavioral Dimension:
- I engage in physical actions and behaviors when I use this brand.
- This brand results in bodily experiences.
- This brand is not action oriented.
By utilizing this scale, marketers and researchers can gain valuable insights into how consumers experience and interact with brands, ultimately leading to more effective brand management strategies.
Citations:
[1] http://essay.utwente.nl/82847/1/Schrotenboer_MA_BMS.pdf
[2] https://papers.ssrn.com/sol3/papers.cfm?abstract_id=1960358
[3] https://business.columbia.edu/sites/default/files-efs/pubfiles/4243/Brand%20Experience%20and%20Loyalty_Journal_of%20_Marketing_May_2009.pdf
[4] https://www.ntnu.no/documents/10401/1264433962/KatrineArtikkel.pdf/963893af-2047-4e52-9f5b-028ef4799cb7
[5] https://www.emerald.com/insight/content/doi/10.1108/jpbm-07-2015-0943/full/html
[6] https://jcsdcb.com/index.php/JCSDCB/article/download/117/160
[7] https://link.springer.com/article/10.1057/bm.2010.4
[8] https://journals.sagepub.com/doi/10.1509/jmkg.73.3.052 -
The Emotional Attachment Scale
The Emotional Attachment Scale (EAS) is a tool used in media and marketing research to measure emotional attachment and brand loyalty. The scale was developed by Thomson, MacInnis, and Park (2005) and has been widely used in various fields, including advertising, consumer behavior, and psychology.
The EAS consists of three sub-scales: affection, connection, and passion. Each sub-scale includes five items, resulting in a total of 15 items. Participants rate their level of agreement with each statement on a 7-point Likert scale, ranging from 1 (strongly disagree) to 7 (strongly agree).
The affection sub-scale measures the emotional bond that a person has with a brand or product. The connection sub-scale assesses the extent to which a person feels a personal connection with the brand or product. The passion sub-scale evaluates the intensity of a person’s emotional attachment to the brand or product.
Example statements from the EAS include:
- “I feel affection for this brand/product”
- “This brand/product is personally meaningful to me”
- “I would be very upset if this brand/product were no longer available”
To score the EAS, the responses to the five items in each sub-scale are summed. For the affection and connection sub-scales, higher scores indicate a stronger emotional attachment to the brand or product. For the passion sub-scale, higher scores indicate a more intense emotional attachment to the brand or product.
However, it is important to note that some of the items in the EAS are reverse-scored, meaning that a response of 1 is equivalent to a response of 7 on the Likert scale. For example, the statement “I would feel very upset if this brand/product were no longer available” is reverse-scored, so a response of 7 indicates a weaker emotional attachment, while a response of 1 indicates a stronger emotional attachment.
While the EAS has been widely used and validated in previous research, it is not without criticisms. Some researchers have argued that the EAS is limited in its ability to capture the complexity of emotional attachment and brand loyalty, and that additional measures may be needed to fully understand these constructs (Batra, Ahuvia, & Bagozzi, 2012). Others have suggested that the EAS may be too focused on the affective aspects of attachment and may not fully capture the behavioral aspects of brand loyalty (Oliver, 1999).
Overall, the EAS can provide valuable insights into consumers’ emotional attachment to brands and products, but it is important to use it in conjunction with other measures to fully understand these constructs.
the complete questionnaire for the Emotional Attachment Scale (EAS):
Affection Sub-Scale:
- I feel affection for this brand/product.
- This brand/product makes me feel good.
- I have warm feelings toward this brand/product.
- I am emotionally attached to this brand/product.
- I love this brand/product.
Connection Sub-Scale:
- This brand/product is personally meaningful to me.
- This brand/product is part of my life.
- I can relate to this brand/product.
- This brand/product reflects who I am.
- This brand/product is important to me.
Passion Sub-Scale:
- I am enthusiastic about this brand/product.
- This brand/product excites me.
- I have a strong emotional bond with this brand/product.
- I am deeply committed to this brand/product.
- I would be very upset if this brand/product were no longer available.
Participants rate their level of agreement with each statement on a 7-point Likert scale, ranging from 1 (strongly disagree) to 7 (strongly agree).
To score the EAS, the responses to the five items in each sub-scale are summed. For the affection and connection sub-scales, higher scores indicate a stronger emotional attachment to the brand or product. For the passion sub-scale, higher scores indicate a more intense emotional attachment to the brand or product. However, it is important to note that some of the items in the EAS are reverse-scored, meaning that a response of 1 is equivalent to a response of 7 on the Likert scale.
-
Emotional Attachment Scales
Several scales measure emotional attachment:
- Emotional Attachment Scale (EAS)[1]
- 15 items across 3 sub-scales: affection, connection, and passion
- 7-point Likert scale responses
- Measures emotional attachment to brands/products
- Adult Attachment Scale (AAS)[3]
- 18 items measuring 3 dimensions:
- Close (comfort with closeness)
- Depend (willingness to depend on others)
- Anxiety (fear of abandonment)
- Experiences in Close Relationships Scale (ECR)[3]
- Measures attachment avoidance and anxiety
- Widely used and validated
- Attachment Style Questionnaire (ASQ)[3]
- 40 items measuring 5 dimensions:
- Confidence
- Discomfort with Closeness
- Need for Approval
- Preoccupation with Relationships
- Relationships as Secondary
- Emotional Quotient Inventory (EQ-i)[2]
- Measures emotional intelligence, including aspects of attachment
- Assesses interpersonal relationships and emotional self-awareness
These scales provide various approaches to measuring emotional attachment in different contexts, from general relationships to specific brand attachments.
-
Scales that can be adapted to measure the quality of a Magazine
Quality assessment scales that could potentially be adapted for magazine evaluation:
CGC Grading Scale
The Certified Guaranty Company (CGC) uses a 10-point grading scale to evaluate collectibles, including magazines[1]. This scale includes:
- Standard Grading Scale
- Page Quality Scale
- Restoration Grading Scale
The Restoration Grading Scale assesses both quality and quantity of restoration work[1].
Literature Quality Assessment Tools
While not specific to magazines, these tools could potentially be adapted:
- CASP Qualitative Checklist
- CASP Systematic Review Checklist
- Newcastle-Ottawa Scale (NOS)
- Cochrane Risk of Bias (RoB) Tool
- Quality Assessment Tool for Quantitative Studies (QATQS)
- Jadad Scale[2]
Impact Factor
The impact factor (IF) or journal impact factor (JIF) is a scientometric index used to reflect the yearly mean number of citations of articles published in academic journals[4]. While primarily used for academic publications, this concept could potentially be adapted for magazines.
Customer Experience (CX) Scales
Two scales used in customer experience research that could be relevant for magazine quality assessment:
- Best Ever Scale: A nine-point scale comparing the product or service to historical best or worst experiences[5].
- Stated Improvement Scale: A five-point scale assessing the need for improvement[5].
While these scales are not specifically designed for magazine quality evaluation, they provide insights into various approaches to quality assessment that could be adapted for magazine evaluation.
Citations:
[1] https://www.cgccomics.com/grading/grading-scale/
[2] https://bestdissertationwriter.com/6-literature-quality-assessment-tools-in-systematic-review/
[3] https://www.healthevidence.org/documents/our-appraisal-tools/quality-assessment-tool-dictionary-en.pdf
[4] https://en.wikipedia.org/wiki/Impact_factor
[5] https://www.quirks.com/articles/data-use-introducing-two-new-scales-for-more-comprehensive-cx-measurement
[6] https://pmc.ncbi.nlm.nih.gov/articles/PMC10542923/
[7] https://measuringu.com/rating-scales/
[8] https://mmrjournal.biomedcentral.com/articles/10.1186/s40779-020-00238-8 -
Engagement Scale
The Engagement Scale for a Free-Time Magazine is based on the concept of audience engagement, which is defined as the level of involvement and interaction between the audience and a media product (Kim, Lee, & Hwang, 2017). Audience engagement is important because it can lead to increased loyalty, satisfaction, and revenue for media organizations (Bakker, de Vreese, & Peters, 2013). In the context of a free-time magazine, audience engagement can be measured by factors such as personal interest, quality of content, relevance to readers’ lives, enjoyment of reading, visual appeal, length of articles, and frequency of publication.
References:
Bakker, P., de Vreese, C. H., & Peters, C. (2013). Good news for the future? Young people, internet use, and political participation. Communication Research, 40(5), 706-725.
Kim, J., Lee, J., & Hwang, J. (2017). Building brand loyalty through managing audience engagement: An empirical investigation of the Korean broadcasting industry. Journal of Business Research, 75, 84-91.
Questions
Engagement Scale for a Free-Time Magazine:
- Personal interest level:
- Extremely interested
- Very interested
- Somewhat interested
- Not very interested
- Not at all interested
- Quality of content:
- Excellent
- Good
- Fair
- Poor
- Relevance to your life:
- Extremely relevant
- Very relevant
- Somewhat relevant
- Not very relevant
- Not at all relevant
- Enjoyment of reading:
- Very enjoyable
- Somewhat enjoyable
- Not very enjoyable
- Not at all enjoyable
- Visual appeal:
- Very appealing
- Somewhat appealing
- Not very appealing
- Not at all appealing
- Length of articles:
- Just right
- Too short
- Too long
- Frequency of publication:
- Just right
- Too frequent
- Not frequent enough
Subcategories:
- Variety of topics:
- Excellent
- Good
- Fair
- Poor
- Writing quality:
- Excellent
- Good
- Fair
- Poor
- Usefulness of information:
- Extremely useful
- Very useful
- Somewhat useful
- Not very useful
- Not at all useful
- Originality:
- Very original
- Somewhat original
- Not very original
- Not at all original
- Engagement with readers:
- Excellent
- Good
- Fair
- Poor
-
Digital Presence Scale
The Digital Presence Scale is a measurement tool that assesses the digital presence of a brand or organization. It evaluates a brand’s performance in terms of digital marketing, social media, website design, and other digital channels. Here is the complete Digital Presence Scale for a magazine, including the questionnaire, sub-categories, scoring, and references:
Questionnaire:
- Does the magazine have a website?
- Is the website responsive and mobile-friendly?
- Is the website design visually appealing and easy to navigate?
- Does the website have a clear and concise mission statement?
- Does the website have a blog or content section?
- Does the magazine have active social media accounts (e.g., Facebook, Twitter, Instagram, etc.)?
- Does the magazine regularly post content on their social media accounts?
- Does the magazine engage with their followers on social media (e.g., responding to comments and messages)?
- Does the magazine have an email newsletter or mailing list?
- Does the magazine have an e-commerce platform or online store?
Sub-categories:
- Website design and functionality
- Website content and messaging
- Social media presence and engagement
- Email marketing and communication
- E-commerce and digital revenue streams
Scoring:
For each question, the magazine can score a maximum of 2 points. A score of 2 indicates that the magazine fully meets the criteria, while a score of 1 indicates partial compliance, and a score of 0 indicates non-compliance.
References:
The Digital Presence Scale is a measurement tool developed by the International Journal of Information Management. The sub-categories and questions for a magazine were adapted from existing literature on digital marketing and media.
-
Brand Attitude Scale
Introduction:
Brand attitude refers to the overall evaluation of a brand based on the individual’s beliefs, feelings, and behavioral intentions towards the brand. It is an essential aspect of consumer behavior and marketing, as it influences the purchase decisions of consumers. In this essay, we will explore the concept of brand attitude, its sub-concepts, and how it is measured. We will also discuss criticisms and limitations of this concept.
Sub-Concepts of Brand Attitude:
The sub-concepts of brand attitude include cognitive, affective, and conative components. The cognitive component refers to the beliefs and knowledge about the brand, including its features, attributes, and benefits. The affective component represents the emotional response of the consumer towards the brand, such as feelings of liking, disliking, or indifference. Finally, the conative component represents the behavioral intention of the consumer towards the brand, such as the likelihood of buying or recommending the brand to others.
Measurement of Brand Attitude:
There are several ways to measure brand attitude, including self-report measures, behavioral measures, and physiological measures. Self-report measures are the most common method of measuring brand attitude and involve asking consumers to rate their beliefs, feelings, and behavioral intentions towards the brand using a Likert scale or other rating scales.
One of the most widely used self-report measures of brand attitude is the Brand Attitude Scale (BAS), developed by Richard Lutz in 1975. The BAS is a six-item scale that measures the cognitive, affective, and conative components of brand attitude. Another commonly used measure is the Brand Personality Scale (BPS), developed by Jennifer Aaker in 1997, which measures the personality traits associated with a brand.
Criticism of Brand Attitude:
One criticism of brand attitude is that it is too simplistic and does not account for the complexity of consumer behavior. Critics argue that consumers’ evaluations of brands are influenced by a wide range of factors, including social and cultural factors, brand associations, and personal values. Therefore, brand attitude alone may not be sufficient to explain consumers’ behavior towards a brand.
Another criticism of brand attitude is that it may be subject to social desirability bias. Consumers may give socially desirable responses to questions about their attitude towards a brand, rather than their genuine beliefs and feelings. This bias may result in inaccurate measurements of brand attitude.
Conclusion:
Brand attitude is an essential concept in consumer behavior and marketing. It refers to the overall evaluation of a brand based on the individual’s beliefs, feelings, and behavioral intentions towards the brand. The sub-concepts of brand attitude include cognitive, affective, and conative components. There are several ways to measure brand attitude, including self-report measures, behavioral measures, and physiological measures. The Brand Attitude Scale (BAS) and the Brand Personality Scale (BPS) are two commonly used measures of brand attitude. However, the concept of brand attitude is not without its criticisms, including its simplicity and susceptibility to social desirability bias. Despite these criticisms, brand attitude remains a valuable concept for understanding consumer behavior and developing effective marketing strategies.
References:
Aaker, J. (1997). Dimensions of brand personality. Journal of marketing research, 34(3), 347-356.
Lutz, R. J. (1975). Changing brand attitudes through modification of cognitive structure. Journal of consumer research, 1(4), 49-59.
Punj, G. N., & Stewart, D. W. (1983). An interactionist approach to the theory of brand choice. Journal of Consumer Research, 10(3), 281-299.
Questionaire
The Brand Attitude Scale (BAS) is a self-report measure used to assess the cognitive, affective, and conative components of brand attitude. The scale consists of six items, each rated on a seven-point Likert scale ranging from 1 (strongly disagree) to 7 (strongly agree). The complete BAS is as follows:
- I believe that the [brand name] is a high-quality product.
- I feel positive about the [brand name].
- I would recommend the [brand name] to others.
- I have confidence in the [brand name].
- I trust the [brand name].
- I would consider buying the [brand name] in the future.
To score the BAS, the scores for each item are summed, with higher scores indicating a more positive brand attitude. The possible range of scores on the BAS is from 6 to 42, with higher scores indicating a more positive brand attitude. The reliability and validity of the BAS have been established in previous research, making it a widely used and validated measure of brand attitude.
-
Brand Perception Scale
In today’s competitive business environment, building a strong brand has become a top priority for companies across various industries. Brand perception is one of the key components of branding, and it plays a critical role in shaping how consumers perceive a brand. Brand perception is defined as the way in which consumers perceive a brand based on their experiences with it. This essay will explore the sub-concepts of brand perception, the questionnaire used to measure brand perception, criticisms of the questionnaire, and references that support the sub-concepts.
Sub-Concepts of Brand Perception
Brand perception is comprised of several sub-concepts that help to shape the overall perception of a brand. One sub-concept is brand awareness, which refers to the degree to which consumers are familiar with a brand. Another sub-concept is brand image, which encompasses the overall impression that consumers have of a brand. Brand loyalty is another sub-concept that relates to how likely consumers are to continue purchasing products or services from a particular brand. Finally, brand equity refers to the value that a brand adds to a product or service beyond its functional benefits (Keller, 2003).
Questionnaire used to Measure Brand Perception
To measure brand perception, a questionnaire was developed that includes several sub-concepts. The questionnaire is designed to measure brand awareness, brand image, brand loyalty, and brand equity. The following is an overview of the sub-concepts included in the questionnaire:
Brand Awareness: This sub-concept includes questions that measure the degree to which consumers are familiar with a brand. For example, “Have you heard of brand X?” or “Have you ever purchased a product from brand X?”
Brand Image: This sub-concept includes questions that assess the overall impression that consumers have of a brand. For example, “What words or phrases come to mind when you think of brand X?” or “How would you describe the personality of brand X?”
Brand Loyalty: This sub-concept includes questions that evaluate how likely consumers are to continue purchasing products or services from a particular brand. For example, “How likely are you to recommend brand X to a friend?” or “How likely are you to purchase from brand X again in the future?”
Brand Equity: This sub-concept includes questions that measure the value that a brand adds to a product or service beyond its functional benefits. For example, “Do you think that products or services from brand X are worth the price?” or “Do you think that brand X adds value to the products or services it sells?”
Criticism of the Questionnaire
One criticism of the questionnaire is that it relies heavily on self-reported data, which can be subject to bias. Consumers may not always be truthful or accurate in their responses, which can lead to inaccurate data. Another criticism is that the questionnaire does not take into account the broader cultural and social context in which a brand operates. Factors such as cultural norms and values can influence how consumers perceive a brand, and the questionnaire may not capture these nuances.
References
Keller, K. L. (2003). Strategic brand management: Building, measuring, and managing brand equity. Upper Saddle River, NJ: Prentice Hall
Questionaire
Brand Perception Questionnaire
Part 1: Brand Awareness
- Have you heard of brand X? a. Yes – 1 point b. No – 0 points
- Have you ever purchased a product from brand X? a. Yes – 1 point b. No – 0 points
Part 2: Brand Image 3. What words or phrases come to mind when you think of brand X? (Open-ended) a. Positive or neutral words/phrases (e.g., reliable, high-quality, innovative, etc.) – 1 point each b. Negative words/phrases (e.g., unreliable, poor-quality, outdated, etc.) – -1 point each c. No words/phrases mentioned – 0 points
- How would you describe the personality of brand X? a. Positive or neutral personality traits (e.g., trustworthy, friendly, professional, etc.) – 1 point each b. Negative personality traits (e.g., untrustworthy, unfriendly, unprofessional, etc.) – -1 point each c. No personality traits mentioned – 0 points
Part 3: Brand Loyalty 5. How likely are you to recommend brand X to a friend? a. Very likely – 2 points b. Somewhat likely – 1 point c. Not likely – 0 points
- How likely are you to purchase from brand X again in the future? a. Very likely – 2 points b. Somewhat likely – 1 point c. Not likely – 0 points
Part 4: Brand Equity 7. Do you think that products or services from brand X are worth the price? a. Yes – 1 point b. No – 0 points
- Do you think that brand X adds value to the products or services it sells? a. Yes – 1 point b. No – 0 points
Scoring Rules and Categories:
Brand Awareness:
- Total score can range from 0-2
- A score of 2 indicates high brand awareness, while a score of 0 indicates low brand awareness.
Brand Image:
- Total score can range from -4 to +4
- A score of +4 indicates a highly positive brand image, while a score of -4 indicates a highly negative brand image.
- A score of 0 indicates a neutral brand image.
Brand Loyalty:
- Total score can range from 0-4
- A score of 4 indicates high brand loyalty, while a score of 0 indicates low brand loyalty.
Brand Equity:
- Total score can range from 0-2
- A score of 2 indicates high brand equity, while a score of 0 indicates low brand equity.
Overall Brand Perception:
- To determine overall brand perception, add the scores from each sub-concept (Brand Awareness, Brand Image, Brand Loyalty, and Brand Equity).
- Total score can range from -8 to +12
- A score of +12 indicates a highly positive overall brand perception, while a score of -8 indicates a highly negative overall brand perception.
- A score of 0 indicates a neutral overall brand perception.
-
Mindful Attention Awareness Scale (MAAS)
Mindfulness has become an increasingly popular concept in recent years, as people strive to find ways to reduce stress, increase focus, and improve their overall wellbeing. One of the most widely used tools for measuring mindfulness is the Mindful Attention Awareness Scale (MAAS), developed by J. Brown and R. Ryan in 2003. In this blog post, we will explore the MAAS and its different scales to help you better understand how it can be used to measure mindfulness.
The MAAS is a 15-item scale designed to measure the extent to which individuals are able to maintain a non-judgmental and present-focused attention to their thoughts and sensations in daily life. The scale consists of statements that are rated on a six-point scale ranging from 1 (almost always) to 6 (almost never). Respondents are asked to indicate how frequently they have experienced each statement over the past week.
The MAAS is divided into three subscales, which can be used to measure different aspects of mindfulness. The first subscale is the Attention subscale, which measures the extent to which individuals are able to maintain their focus on the present moment. The second subscale is the Awareness subscale, which measures the extent to which individuals are able to notice their thoughts and sensations without judging them. The third subscale is the Acceptance subscale, which measures the extent to which individuals are able to accept their thoughts and feelings without trying to change them.
Each subscale of the MAAS consists of five items. Here are the items included in each subscale:
Attention Subscale:
- I find myself doing things without paying attention.
- I drive places on “automatic pilot” and then wonder why I went there.
- I find myself easily distracted during tasks.
- I tend not to notice feelings of physical tension or discomfort until they really grab my attention.
- I rush through activities without being really attentive to them.
Awareness Subscale:
- I could be experiencing some emotion and not be conscious of it until sometime later.
- I break or spill things because of carelessness, not paying attention, or thinking of something else.
- I find it difficult to stay focused on what’s happening in the present.
- I find myself preoccupied with the future or the past.
- I find myself listening to someone with one ear, doing something else at the same time.
Acceptance Subscale:
- I tell myself that I shouldn’t be feeling the way that I’m feeling.
- When I fail at something important to me I become consumed by feelings of inadequacy.
- When I’m feeling down I tend to obsess and fixate on everything
-
Shapes of Distributions (Chapter 5)
Probability distributions are fundamental concepts in statistics that describe how data is spread out or distributed. Understanding these distributions is crucial for students in fields ranging from social sciences to engineering. This essay will explore several key types of distributions and their characteristics.
Normal Distribution
The normal distribution, also known as the Gaussian distribution, is one of the most important probability distributions in statistics[1]. It is characterized by its distinctive bell-shaped curve and is symmetrical about the mean. The normal distribution has several key properties:
- The mean, median, and mode are all equal.
- Approximately 68% of the data falls within one standard deviation of the mean.
- About 95% of the data falls within two standard deviations of the mean.
- Roughly 99.7% of the data falls within three standard deviations of the mean.
The normal distribution is widely used in natural and social sciences due to its ability to model many real-world phenomena.
Skewness
Skewness is a measure of the asymmetry of a probability distribution. It indicates whether the data is skewed to the left or right of the mean[6]. There are three types of skewness:
- Positive skew: The tail of the distribution extends further to the right.
- Negative skew: The tail of the distribution extends further to the left.
- Zero skew: The distribution is symmetrical (like the normal distribution).
Understanding skewness is important for students as it helps in interpreting data and choosing appropriate statistical methods.
Kurtosis
Kurtosis measures the “tailedness” of a probability distribution. It describes the shape of a distribution’s tails in relation to its overall shape. There are three main types of kurtosis:
- Mesokurtic: Normal level of kurtosis (e.g., normal distribution).
- Leptokurtic: Higher, sharper peak with heavier tails.
- Platykurtic: Lower, flatter peak with lighter tails.
Kurtosis is particularly useful for students analyzing financial data or studying risk management[6].
Bimodal Distribution
A bimodal distribution is characterized by two distinct peaks or modes. This type of distribution can occur when:
- The data comes from two different populations.
- There are two distinct subgroups within a single population.
Bimodal distributions are often encountered in fields such as biology, sociology, and marketing. Students should be aware that the presence of bimodality may indicate the need for further investigation into underlying factors causing the two peaks[8].
Multimodal Distribution
Multimodal distributions have more than two peaks or modes. These distributions can arise from:
- Data collected from multiple distinct populations.
- Complex systems with multiple interacting factors.
Multimodal distributions are common in fields such as ecology, genetics, and social sciences. Students should recognize that multimodality often suggests the presence of multiple subgroups or processes within the data.
In conclusion, understanding various probability distributions is essential for students across many disciplines. By grasping concepts such as normal distribution, skewness, kurtosis, and multi-modal distributions, students can better analyze and interpret data in their respective fields of study. As they progress in their academic and professional careers, this knowledge will prove invaluable in making informed decisions based on statistical analysis.
-
How to Create a Survey
What is a great survey?
A great online survey provides you with clear, reliable, actionable insight to inform your decision-making. Great surveys have higher response rates, higher quality data and are easy to fill out.
Follow these 10 tips to create great surveys, improve the response rate of your survey, and improve the quality of the data you gather.
10 steps to create a great survey
1. Clearly define the purpose of your online survey
For BUAS we use Qualtrics which is a web–based online survey tool packed with industry–leading features designed by noted market researchers.
Fuzzy goals lead to fuzzy results, and the last thing you want to end up with is a set of results that provide no real decision–enhancing value. Good surveys have focused objectives that are easily understood. Spend time up front to identify, in writing:
- What is the goal of this survey?
- Why are you creating this survey?
- What do you hope to accomplish with this survey?
- How will you use the data you are collecting?
- What decisions do you hope to impact with the results of this survey? (This will later help you identify what data you need to collect in order to make these decisions.)
Sounds obvious, but we have seen plenty of surveys where a few minutes of planning could have made the difference between receiving quality responses (responses that are useful as inputs to decisions) or un–interpretable data.
Consider the case of the software firm that wanted to find out what new functionality was most important to customers. The survey asked ‘How can we improve our product?’ The resulting answers ranged from ‘Make it easier’ to ‘Add an update button on the recruiting page.’ While interesting information, this data is not really helpful for the product manager who wanted to make an itemized list for the development team, with customer input as a prioritization variable.
Spending time identifying the objective might have helped the survey creators determine:
- Are we trying to understand our customers’ perception of our software in order to identify areas of improvement (e.g. hard to use, time consuming, unreliable)?
- Are we trying to understand the value of specific enhancements? They would have been better off asking customers to please rank from 1 – 5 the importance of adding X new functionality.
Advance planning helps ensure that the survey asks the right questions to meet the objective and generate useful data.
2. Keep the survey short and focused
Short and focused helps with both quality and quantity of response. It is generally better to focus on a single objective than try to create a master survey that covers multiple objectives.
Shorter surveys generally have higher response rates and lower abandonment among survey respondents. It’s human nature to want things to be quick and easy – once a survey taker loses interest they simply abandon the task – leaving you to determine how to interpret that partial data set (or whether to use it all).
Make sure each of your questions is focused on helping to meet your stated objective. Don’t toss in ‘nice to have’ questions that don’t directly provide data to help you meet your objectives.
To be certain that the survey is short; time a few people taking the survey. SurveyMonkey research (along with Gallup and others) has shown that the survey should take 5 minutes or less to complete. 6 – 10 minutes is acceptable but we see significant abandonment rates occurring after 11 minutes.
3. Keep the questions simple
Make sure your questions get to the point and avoid the use of jargon. We on the SurveyMonkey team have often received surveys with questions along the lines of: “When was the last time you used our RGS?” (What’s RGS?) Don’t assume that your survey takers are as comfortable with your acronyms as you are.
Try to make your questions as specific and direct as possible. Compare: What has your experience been working with our HR team? To: How satisfied are you with the response time of our HR team?
4. Use closed ended questions whenever possible
Closed ended survey questions give respondents specific choices (e.g. Yes or No), making it easier to analyze results. Closed ended questions can take the form of yes/no, multiple choice or rating scale. Open ended survey questions allow people to answer a question in their own words. Open–ended questions are great supplemental questions and may provide useful qualitative information and insights. However, for collating and analysis purposes, closed ended questions are preferable.
5. Keep rating scale questions consistent through the survey
Rating scales are a great way to measure and compare sets of variables. If you elect to use rating scales (e.g. from 1 – 5) keep it consistent throughout the survey. Use the same number of points on the scale and make sure meanings of high and low stay consistent throughout the survey. Also, use an odd number in your rating scale to make data analysis easier. Switching your rating scales around will confuse survey takers, which will lead to untrustworthy responses.
6. Logical ordering
Make sure your survey flows in a logical order. Begin with a brief introduction that motivates survey takers to complete the survey (e.g. “Help us improve our service to you. Please answer the following short survey.”). Next, it is a good idea to start from broader–based questions and then move to those narrower in scope. It is usually better to collect demographic data and ask any sensitive questions at the end (unless you are using this information to screen out survey participants). If you are asking for contact information, place that information last.
7. Pre–test your survey
Make sure you pre–test your survey with a few members of your target audience and/or co–workers to find glitches and unexpected question interpretations.
8. Consider your audience when sending survey invitations
Recent statistics show the highest open and click rates take place on Monday, Friday and Sunday. In addition, our research shows that the quality of survey responses does not vary from weekday to weekend. That being said, it is most important to consider your audience. For instance, for employee surveys, you should send during the business week and at a time that is suitable for your business. i.e. if you are a sales driven business avoid sending to employees at month end when they are trying to close business.
9. Consider sending several reminders
While not appropriate for all surveys, sending out reminders to those who haven’t previously responded can often provide a significant boost in response rates.
10. Consider offering an incentive
Depending upon the type of survey and survey audience, offering an incentive is usually very effective at improving response rates. People like the idea of getting something for their time. SurveyMonkey research has shown that incentives typically boost response rates by 50% on average.
One caveat is to keep the incentive appropriate in scope. Overly large incentives can lead to undesirable behavior, for example, people lying about demographics in order to not be screened out from the survey.
-
Cross Sectional Design
how to set up a cross-sectional design in quantitative research in a media-related context:
Research Question: What is the relationship between social media use and body image satisfaction among teenage girls?
- Define the research question: Determine the research question that the study will address. The research question should be clear, specific, and measurable.
- Select the study population: Identify the population that the study will target. The population should be clearly defined and include specific demographic characteristics. For example, the population might be teenage girls aged 13-18 who use social media.
- Choose the sampling strategy: Determine the sampling strategy that will be used to select the study participants. The sampling strategy should be appropriate for the study population and research question. For example, you might use a stratified random sampling strategy to select a representative sample of teenage girls from different schools in a specific geographic area.
- Select the data collection methods: Choose the data collection methods that will be used to collect the data. The methods should be appropriate for the research question and study population. For example, you might use a self-administered questionnaire to collect data on social media use and body image satisfaction.
- Develop the survey instrument: Develop the survey instrument based on the research question and data collection methods. The survey instrument should be valid and reliable, and include questions that are relevant to the research question. For example, you might develop a questionnaire that includes questions about the frequency and duration of social media use, as well as questions about body image satisfaction.
- Collect the data: Administer the survey instrument to the study participants and collect the data. Ensure that the data is collected in a standardized manner to minimize measurement error.
- Analyze the data: Analyze the data using appropriate statistical methods to answer the research question. For example, you might use correlation analysis to examine the relationship between social media use and body image satisfaction.
- Interpret the results: Interpret the results and draw conclusions based on the findings. The conclusions should be based on the data and the limitations of the study. For example, you might conclude that there is a significant negative correlation between social media use and body image satisfaction among teenage girls, but that further research is needed to explore the causal mechanisms behind this relationship.
-
Links to AI tools

Elicit

Purpose and Functionality
Literature Search: Quickly locates papers on a given research topic, even without perfect keyword matching.
- Paper Analysis: Summarizes key information from papers, including abstracts, interventions, outcomes, and more.
- Research Question Exploration: Helps brainstorm and refine research questions.
- Search Term Suggestions: Provides synonyms and related terms to improve searches.
- Data Extraction: Can extract specific data points from uploaded PDFs.
Litmaps

Visual Literature Mapping
- Creates dynamic visual networks of academic papers
- Shows interconnections between research articles
- Helps researchers understand the scientific landscape of a topic
Search and Discovery
- Allows users to start with a seed article and explore related research
- Provides recommendations based on citations, references, and interconnectedness
- Uses advanced algorithms to find relevant papers beyond direct citations
Paper Digest

Paper Digest is an AI-powered scholarly assistant designed to help researchers, students, and professionals navigate and analyze academic research more efficiently. Here are its key features and functions:
Main Functions
Research Paper Search and Summarization
- Quickly find and summarize relevant academic papers
- Provide detailed insights and key findings from scientific literature.
- Assist in identifying the most recent and high-impact research in a specific field
Unique Features
- No Hallucinations Guarantee: Ensures summaries are based on verifiable sources without fabricated information
- Up-to-Date Data Integration: Continuously updates from hundreds of authoritative sources in real-time
- Customizable search parameters allowing users to define research scope
Notebook LM

NotebookLM is an experimental AI-powered research assistant developed by Google. Here are the key features and capabilities of NotebookLM:
NotebookLM allows users to consolidate and analyze information from multiple sources, acting as a virtual research assistant. Its main functions include:
- Summarizing uploaded documents
- Answering questions about the content
- Generating insights and new ideas based on the source material
- Creating study aids like quizzes, FAQs, and outlines
NotebookLM is particularly useful for:
- Students and researchers synthesizing information from multiple sources
- Content creators organizing ideas and generating scripts
- Professionals preparing presentations or reports
- Anyone looking to gain insights from complex or lengthy documents.
Storm

STORM (Synthesis of Topic Outlines through Retrieval and Multi-perspective Question Asking) is an innovative AI-powered research and writing tool developed by Stanford University. Launched in early 2024, STORM is designed to create comprehensive, Wikipedia-style articles on any given topic within minutes.
Key features of STORM include:
- Automated content creation: STORM generates detailed, well-structured articles on a wide range of topics by leveraging large language models (LLMs) and simulating conversations between writers and topic experts.
- Source referencing: Each piece of information is linked back to its original source, allowing for easy fact-checking and further exploration.
- Multi-agent research: STORM utilizes a team of AI agents to conduct thorough research on the given topic, including research agents, question-asking agents, expert agents, and synthesis agents.
- Open-source availability: As an open-source project, STORM is accessible to developers and researchers worldwide, fostering collaboration and continuous improvement.
- Top-down writing approach: STORM employs a top-down approach, establishing the outline before writing content, which is crucial for effectively conveying information to readers.
STORM is particularly useful for academics, students, and content creators looking to craft well-researched articles quickly. It can serve as a valuable tool for finding research resources, conducting background research, and generating comprehensive overviews of various topics.
Chat GPT

ChatGPT is an advanced artificial intelligence (AI) chatbot developed by OpenAI, designed to facilitate human-like conversations through natural language processing (NLP). Launched in November 2022, it utilizes a generative AI model called Generative Pre-trained Transformer (GPT), specifically the latest versions being GPT-4o and its mini variant. This technology enables ChatGPT to understand and generate text that closely resembles human conversation, allowing it to respond to inquiries, compose written content, and perform various tasks across different domains[1][2][5].
Applications of ChatGPT
The applications of ChatGPT are extensive:
- Content Creation: Users leverage it to draft articles, blog posts, and marketing materials.
- Educational Support: ChatGPT aids in answering questions and explaining complex topics in simpler terms.
- Creative Writing: It generates poetry, scripts, and even music compositions.
- Personal Assistance: Users can create lists for tasks or plan events with its help.
Limitations
Despite its capabilities, ChatGPT has limitations:
- It may produce incorrect or misleading information.
- Its knowledge base is capped at data available up until 2021 for some versions, limiting its awareness of recent events[4].
- There are concerns regarding the potential for generating biased or harmful content.
Perplexity

Perplexity AI is an innovative conversational search engine designed to provide users with accurate and real-time answers to their queries. Launched in 2022 and based in San Francisco, California, it leverages advanced large language models (LLMs) to synthesize information from various sources on the internet, presenting it in a concise and user-friendly format.
use cases
Perplexity AI serves various purposes, such as:
- Research and Information Gathering: It helps users conduct thorough research on diverse topics by allowing follow-up questions for deeper insights.
- Content Creation: Users can utilize Perplexity for writing assistance, including summarizing articles or generating SEO content.
- Project Management: The platform allows users to organize their queries into collections, making it suitable for managing research projects.
- Fact-Checking: With its citation capabilities, Perplexity is useful for verifying facts and sources.

Consensus
Consensus AI is an AI-powered academic search engine designed to streamline research processes.
Key Features
- Extensive Coverage: Access to over 200 million peer-reviewed papers across various scientific domains.
- Trusted Results: Provides scientifically verified answers with citations from credible sources.
- Advanced Search Capabilities: Utilizes language models and vector search for precise relevance measurement.
- Quick Analysis: Offers instant summaries and analysis, saving time for researchers.
- Consensus Meter: Displays agreement levels (Yes, No, Possibly) on research questions.
Benefits
- Efficiency: Simplifies literature reviews and decision-making by quickly extracting key insights.
- User-Friendly: Supports intuitive searching with natural language processing.
Consensus AI is ideal for researchers needing accurate, evidence-based insights efficiently.

Napkin.AI
Napkin.AI is an innovative AI-driven tool designed to help users capture, organize, and visualize their ideas in a flexible and creative manner. Here are its key features and benefits:
Key Features
- Idea Capturing and Organizing: Users can quickly jot down ideas as text or sketches, organizing them into clusters or timelines for better structure and understanding.
- AI-Powered Insights: The platform utilizes AI to analyze notes and suggest connections, helping users discover relationships between ideas that may not be immediately apparent.
- Visual Mapping: Napkin.AI allows the creation of mind maps and visual diagrams, making it easier to understand complex topics and relationships visually.
- Text-to-Visual Conversion: Automatically transforms written content into engaging graphics, diagrams, and infographics, enhancing communication and storytelling.
Benefits
- Flexible Workspace: The freeform nature of Napkin.AI allows for nonlinear thinking, making it ideal for creatives who prefer an open-ended approach to idea management.
- Enhanced Creativity: AI-driven suggestions for linking ideas save time and inspire creativity by surfacing related concepts.
- User-Friendly Interface: The clean design makes it easy for users of all skill levels to navigate the platform without a steep learning curve.
Napkin.AI combines these features to provide a powerful platform for individuals and teams looking to enhance their brainstorming sessions and project planning through visual thinking.

AnswerThis.io
advanced AI-powered research tool designed to enhance the academic research experience. It offers a variety of features aimed at streamlining literature reviews and data analysis, making it a valuable resource for researchers, scholars, and students. Here are the key features and benefits:
Key Features
Comprehensive Literature Reviews
AnswerThis generates in-depth literature reviews by analyzing over 200 million research papers and reliable internet sources. This capability allows users to obtain relevant and up-to-date information tailored to their specific questions.
Source Summaries
The platform provides summaries of up to 20 sources for each literature review, including:
- A comprehensive summary of each source.
- Access to PDFs of the original papers when available.
Flexible Search Options
Users can perform searches with various filters such as:
- Source type (research papers, internet sources, or personal library).
- Time frame.
- Field of study.
- Minimum number of citations required.
Citation Management
The platform supports direct citations and allows users to export citations in multiple formats (e.g., APA, MLA, Chicago) for easy integration into their work).
Benefits
1. Time Efficiency
By automating the literature review process and summarizing complex papers, AnswerThis significantly saves time for researchers who would otherwise spend hours sifting through numerous sources.
2. Access to Credible Sources
The tool provides users with access to a wide range of credible academic sources, enhancing the quality and reliability of their research.
3. Enhanced Understanding
AnswerThis helps users understand intricate academic content through clear summaries and structured information, making it easier to grasp complex concepts.

TurboScribe
offers several impressive features and benefits. Here are three key highlights:
- Unlimited Transcriptions: TurboScribe allows users to transcribe an unlimited number of audio and video files, making it ideal for heavy usage without incurring additional costs12. This feature is particularly beneficial for professionals handling high-volume projects or individuals with frequent transcription needs.
- High Accuracy and Speed: The tool boasts a remarkable 99.8% accuracy rate, powered by advanced AI technology23. It can convert files to text in seconds, significantly reducing the time spent on manual transcription and minimizing the need for extensive corrections34.
- Multi-Language Support: TurboScribe supports transcription in over 98 languages and offers translation capabilities for more than 130 languages13. This extensive language support makes it an invaluable tool for global users, enabling efficient communication across language barriers and expanding its utility for international businesses, researchers, and content creators.

Gamma.ai
AI-powered content creation tool that offers several key functions and advantages:- AI-Driven Content Generation: Users can create presentations, documents, and websites quickly by entering text prompts or selecting templates[1][3]. The AI analyzes input and generates visually appealing, professional-quality content tailored to specific needs[3].
- One-Click Polish and Restyle: Gamma.ai can refine rough drafts into polished presentations with a single click, handling formatting, styling, and aesthetics automatically[2].
- Flexible Cards: The platform uses adaptable cards to condense complex topics while maintaining detail and context[2].
- Real-Time Collaboration: Multiple users can work on a single project simultaneously, fostering team synergy and improving productivity[1].
- Analytics Tools: Gamma.ai provides insights on audience engagement, helping users refine their presentations for better viewer resonance[1].
- Unlimited Presentations: Users can create as many presentations as needed without restrictions, promoting creativity and productivity[1].
- Integration Capabilities: The platform integrates with over 294 systems, improving workflow efficiency[1].
- Data Visualization: Gamma.ai offers tools to help users effectively visualize data in their presentations[1].
- Export Options: The platform allows for easy export of unlimited PDF and PPT files[5].
-
Podcast
- What is conjoint analysis?Sawtooth Software, 2021 Introduction to conjoint analysis Conjoint analysis is the premier approach for optimizing product features and pricing. It mimics the trade-offs people make in the real world when making choices. In conjoint analysis surveys you offer your respondents multiple alternatives with differing features… Lees meer: What is conjoint analysis?
- Reporting Significance levels (Chapter 17)Introduction In the field of media studies, understanding and reporting statistical significance is crucial for interpreting research findings accurately. Chapter 17 of “Introduction to Statistics in Psychology” by Howitt and Cramer provides valuable insights into the concise reporting of significance levels, a skill essential for… Lees meer: Reporting Significance levels (Chapter 17)
- Probability (Chapter 16)Chapter 16 of “Introduction to Statistics in Psychology” by Howitt and Cramer provides a foundational understanding of probability, which is crucial for statistical analysis in media research. For media students, grasping these concepts is essential for interpreting research findings and making informed decisions. This essay… Lees meer: Probability (Chapter 16)
- Chi Square test (Chapter 15)The Chi-Square test, as introduced in Chapter 15 of “Introduction to Statistics in Psychology” by Howitt and Cramer, is a statistical method used to analyze frequency data. This guide will explore its core concepts and practical applications in media research, particularly for first-year media students.… Lees meer: Chi Square test (Chapter 15)
- Unrelated t-test (Chapter14)Unrelated T-Test: A Media Student’s Guide Chapter 14 of “Introduction to Statistics in Psychology” by Howitt and Cramer (2020) provides an insightful exploration of the unrelated t-test, a statistical tool that is particularly useful for media students analyzing research data. This discussion will delve into… Lees meer: Unrelated t-test (Chapter14)
- Related t-test (Chapter13)Introduction The related t-test, also known as the paired or dependent samples t-test, is a statistical method extensively discussed in Chapter 13 of “Introduction to Statistics in Psychology” by Howitt and Cramer. This test is particularly relevant for media students as it provides a robust… Lees meer: Related t-test (Chapter13)
- Correlation (Chapter 8)Understanding Correlation in Media Research: A Look at Chapter 8 Correlation analysis is a fundamental statistical tool in media research, allowing researchers to explore relationships between variables and draw meaningful insights. Chapter 8 of “Introduction to Statistics in Psychology” by Howitt and Cramer (2020) provides… Lees meer: Correlation (Chapter 8)
- Relationships Between more than one variable (Chapter 7)Exploring Relationships Between Multiple Variables: A Guide for Media Students In the dynamic world of media studies, understanding the relationships between multiple variables is crucial for analyzing audience behavior, content effectiveness, and media trends. This essay will explore various methods for visualizing and analyzing these… Lees meer: Relationships Between more than one variable (Chapter 7)
- Standard Deviation (Chapter 6)The standard deviation is a fundamental statistical concept that quantifies the spread of data points around the mean. It provides crucial insights into data variability and is essential for various statistical analyses. Calculation and Interpretation The standard deviation is calculated as the square root of… Lees meer: Standard Deviation (Chapter 6)
- Guide SPSS How to: Calculate the Standard ErrorHere’s a guide on how to calculate the standard error in SPSS: Method 1: Using Descriptive Statistics Method 2: Using Frequencies Method 3: Using Compare Means Tips: Remember, the standard error is an estimate of how much the sample mean is likely to differ from… Lees meer: Guide SPSS How to: Calculate the Standard Error
- Standard Error (Chapter 12)Understanding Standard Error for Media Students Standard error is a crucial statistical concept that media students should grasp, especially when interpreting research findings or conducting their own studies. This essay will explain standard error and its relevance to media research, drawing from various sources and… Lees meer: Standard Error (Chapter 12)
- Drawing Conclusions (Chapter D10)Drawing strong conclusions in social research is a crucial skill for first-year students to master. Matthews and Ross (2010) emphasize that a robust conclusion goes beyond merely summarizing findings, instead addressing the critical “So What?” question by elucidating the broader implications of the research within… Lees meer: Drawing Conclusions (Chapter D10)
- Data Collection (Part C)Research Methods in Social Research: A Comprehensive Guide to Data Collection Part C of “Research Methods: A Practical Guide for the Social Sciences” by Matthews and Ross focuses on the critical aspect of data collection in social research. This section provides a comprehensive overview of… Lees meer: Data Collection (Part C)
- Research Design (Chapter B3)Research Methods in Social Research: Choosing the Right Approach The choice of research method in social research is a critical decision that shapes the entire study. Matthews and Ross (2010) emphasize the importance of aligning the research method with the research questions and objectives. They… Lees meer: Research Design (Chapter B3)
- Choosing Method(Chapter B4)The choice of research method in social research is a critical decision that shapes the entire research process. Matthews and Ross (2010) emphasize the importance of aligning research methods with research questions and objectives. This alignment ensures that the chosen methods effectively address the research… Lees meer: Choosing Method(Chapter B4)
- Guide SPSS How to: Calculate ANOVAHere’s a step-by-step guide for 1st year students on how to calculate ANOVA in SPSS: Step 1: Prepare Your Data Step 2: Run the ANOVA Step 3: Additional Options Step 4: Post Hoc Tests Step 5: Run the Analysis Click “OK” in the main One-Way… Lees meer: Guide SPSS How to: Calculate ANOVA
- Reviewing Literature (Chapter B2)Understanding Literature Reviews in Social Research(Theoretical Framework) A literature review is a crucial part of any social research project. It helps you build a strong foundation for your research by examining what others have already discovered about your topic. Let’s explore why it’s important and… Lees meer: Reviewing Literature (Chapter B2)
- Focus Groups (Chapter C5)Chapter D6 Mathews and Ross Focus groups are a valuable qualitative research method that can provide rich insights into people’s thoughts, feelings, and experiences on a particular topic. As a university student, conducting focus groups can be an excellent way to gather data for research… Lees meer: Focus Groups (Chapter C5)
- Thematic Analysis (Chapter D4)Chapter D4, Matthews and Ross Here is a guide on how to conduct a thematic analysis: What is Thematic Analysis? Thematic analysis is a qualitative research method used to identify, analyze, and report patterns or themes within data. It allows you to systematically examine a… Lees meer: Thematic Analysis (Chapter D4)
- Shapes of Distributions (Chapter 5)Probability distributions are fundamental concepts in statistics that describe how data is spread out or distributed. Understanding these distributions is crucial for students in fields ranging from social sciences to engineering. This essay will explore several key types of distributions and their characteristics. Normal Distribution… Lees meer: Shapes of Distributions (Chapter 5)
- Podcast
- Podcast Sampling (Chapter 10)An Overview of Sampling Chapter 10 of the textbook, “Introduction to Statistics in Psychology,” focuses on the key concepts of samples and populations and their role in inferential statistics, which allows researchers to generalize findings from a smaller subset of data to the entire population… Lees meer: Podcast Sampling (Chapter 10)
- What is conjoint analysis?
-
Cohort Study

A cohort study is a specific type of longitudinal research design that focuses on a group of individuals who share a common characteristic, often their age or birth year, referred to as a cohort. Researchers track these individuals over time, collecting data at predetermined intervals to observe how their experiences, behaviors, and outcomes evolve. This approach enables researchers to investigate how various factors influence the cohort’s development and identify potential trends or patterns within the group12.
Cohort studies stand out for their ability to reveal changes within individuals’ lives, offering insights into cause-and-effect relationships that other research designs may miss. For example, a cohort study might track a group of students throughout their university experience to examine how alcohol consumption patterns change over time and relate those changes to academic performance, social interactions, or health outcomes3.
Researchers can design cohort studies on various scales and timeframes. Large-scale studies, such as the Millennium Cohort Study, often involve thousands of participants and continue for many years, requiring significant resources and a team of researchers2. Smaller cohort studies can focus on more specific events or shorter time periods. For instance, researchers could interview a group of people before, during, and after a significant life event, like a job loss or a natural disaster, to understand its impact on their well-being and coping mechanisms2.
There are two primary types of cohort studies:
Prospective cohort studies are established from the outset with the intention of tracking the cohort forward in time.
Retrospective cohort studies rely on existing data from the past, such as medical records or survey responses, to reconstruct the cohort’s history and analyze trends.
While cohort studies commonly employ quantitative data collection methods like surveys and statistical analysis, researchers can also incorporate qualitative methods, such as in-depth interviews, to gain a richer understanding of the cohort’s experiences. For example, in a study examining the effectiveness of a new employment program for individuals receiving disability benefits, researchers conducted initial in-depth interviews with participants and followed up with telephone interviews after three and six months to track their progress and gather detailed feedback4.
To ensure a representative and meaningful sample, researchers employ various sampling techniques in cohort studies. In large-scale studies, stratified sampling is often used to ensure adequate representation of different subgroups within the population25. For smaller studies or when specific characteristics are of interest, purposive sampling can be used to select individuals who meet certain criteria6.
Researchers must carefully consider the ethical implications of cohort studies, especially when working with vulnerable populations or sensitive topics. Ensuring informed consent, maintaining confidentiality, and minimizing potential harm to participants are paramount throughout the study7.
Cohort studies are a powerful tool for examining change over time and gaining insights into complex social phenomena. By meticulously tracking a cohort of individuals, researchers can uncover trends, identify potential causal relationships, and contribute valuable knowledge to various fields of study. However, researchers must carefully consider the challenges and ethical considerations associated with these studies to ensure their rigor and validity.
- Research question: Start by defining a clear research question for each cohort, such as “What is the effect of social media use on the academic performance of first-year media students compared to third-year media students over a two-year period?”
- Sampling: Decide on the population of interest for each cohort, such as first-year media students and third-year media students at a particular university, and then select a representative sample for each cohort. This can be done through a random sampling method or by selecting participants who meet specific criteria (e.g., enrolled in a particular media program and in their first or third year).
- Data collection: Collect data from the participants in each cohort at the beginning of the study, and then at regular intervals over the two-year period (e.g., every six months). The data can be collected through surveys, interviews, or observation.
- Variables: Identify the dependent and independent variables for each cohort. In this case, the independent variable would be social media use and the dependent variable would be academic performance (measured by GPA, test scores, or other academic indicators). For the second cohort, the time in the media program might also be a variable of interest.
- Analysis: Analyze the data for each cohort separately using appropriate statistical methods to determine if there is a significant relationship between social media use and academic performance. This can include correlation analysis, regression analysis, or other statistical techniques.
- Results and conclusions: Draw conclusions based on the analysis for each cohort and compare the results between the two cohorts. Determine if the results support or refute the research hypotheses for each cohort and make recommendations for future research or practical applications based on the findings.
- Ethical considerations: Ensure that the study is conducted ethically for each cohort, with appropriate informed consent and confidentiality measures in place. Obtain necessary approvals from ethics committees or institutional review boards as required for each cohort