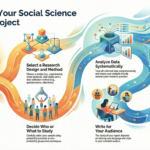
- The research Journey
 Based on Chapter B6 Bob Matthews and Liz Ross
 - How to Cite Other Authors:Whether you’re writing a research paper, production report, script analysis, or academic blogpost, citing your sources correctly is essential. In media studies, referencing isn’t just a bureaucratic requirement—it shows academic honesty, strengthens your arguments, and lets others trace your ideas back to reliable sources.
- Building your Research Instrument 2
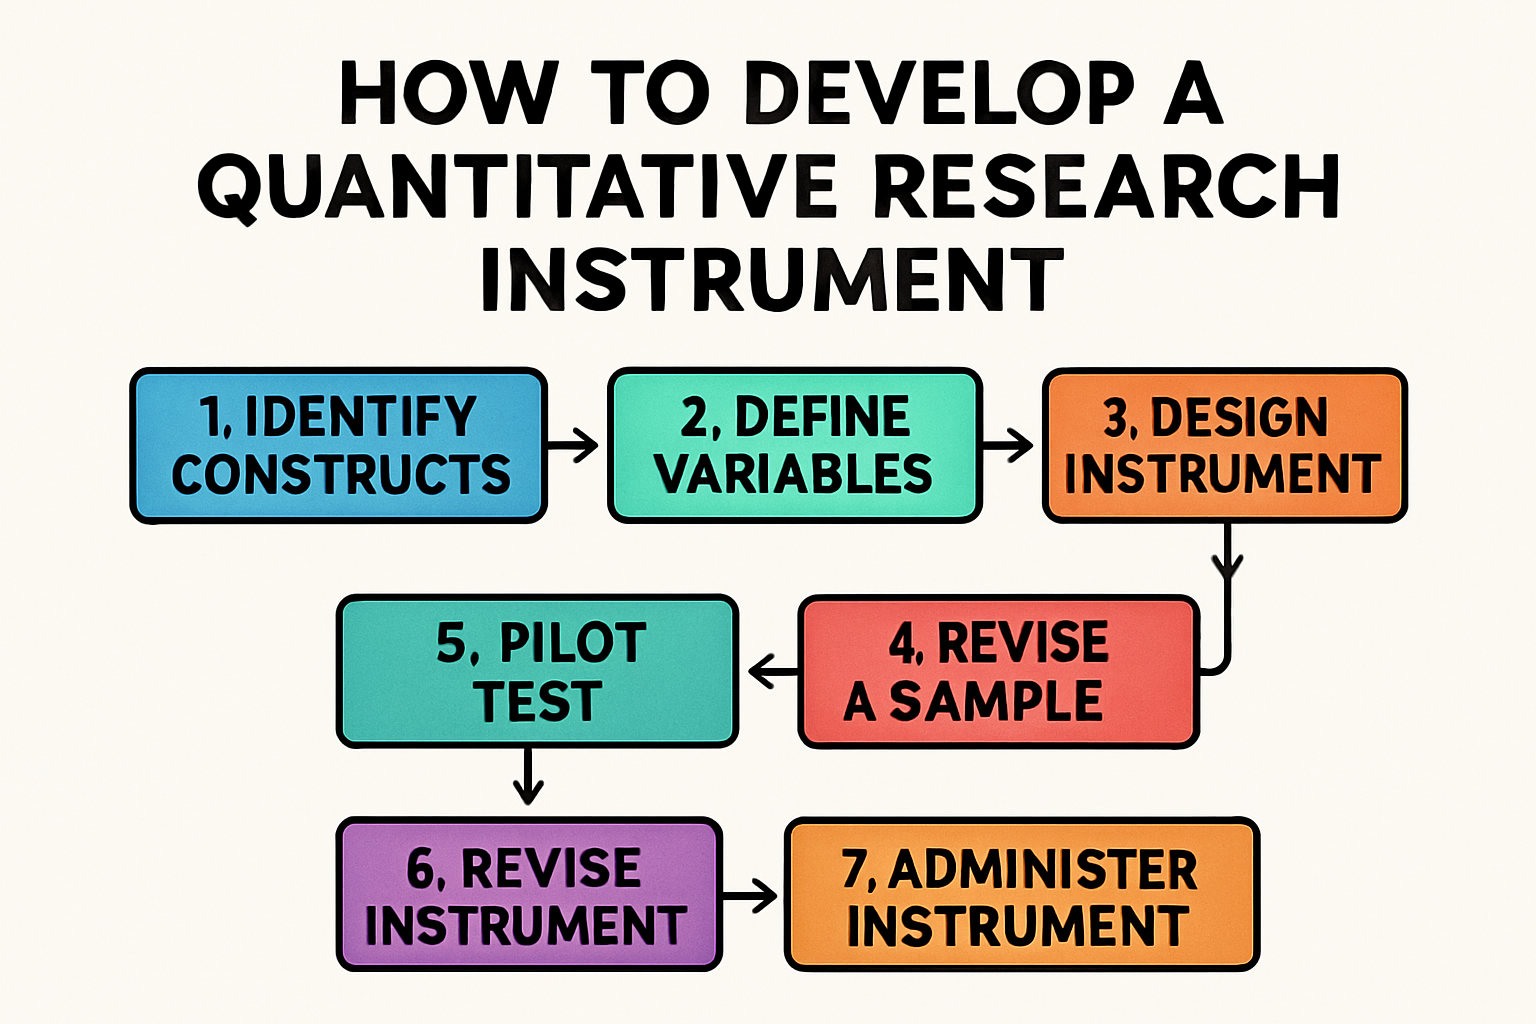 How to Develop a Research Instrument: An Eight-Step Process 1. Select a TopicBegin with a clear understanding of what you want to study. Your topic should be focused enough to be manageable but broad enough to be meaningful.… Lees meer: Building your Research Instrument 2
 - Understanding the Power of Z-Scores in Data Analysis: Why Standardization Matters in Media ResearchIntroduction In data analysis, especially within the social and media sciences, researchers often confront datasets composed of variables that operate on entirely different scales. Audience reach may be expressed in millions of viewers, engagement rates in percentages, and… Lees meer: Understanding the Power of Z-Scores in Data Analysis: Why Standardization Matters in Media Research
- Is Correlation the same as Causation?📺 Correlation and Causation in Media Studies When studying media, we often hear claims like: What “correlation” means in media research In media studies, correlation refers to a measurable relationship between two variables. For example: A correlation means… Lees meer: Is Correlation the same as Causation?
- What is conjoint analysis?Sawtooth Software, 2021 Introduction to conjoint analysis Conjoint analysis is the premier approach for optimizing product features and pricing. It mimics the trade-offs people make in the real world when making choices. In conjoint analysis surveys you offer… Lees meer: What is conjoint analysis?
- Loss Aversion in Marketing:
 Loss aversion, a cornerstone of behavioral economics, profoundly impacts consumer decision-making in marketing. It describes the tendency for individuals to feel the pain of a loss more strongly than the pleasure of an equivalent gain (Peng, 2025), (Frank,… Lees meer: Loss Aversion in Marketing:
 - Anova
- Confidence IntervalAs a teacher, I often find that confidence intervals can be a tricky concept for students to grasp. However, they’re an essential tool in statistics that helps us make sense of data and draw meaningful conclusions. In this… Lees meer: Confidence Interval
- RegressionStatistical regression is a powerful analytical tool widely used in the media industry to understand relationships between variables and make predictions. This essay will explore the concept of regression analysis and its applications in media, providing relevant examples… Lees meer: Regression
- Levels of Measurement (video)Levels of measurement are classifications used to describe the nature of data in variables. There are four main levels of measurement: nominal, ordinal, interval, and ratio. Nominal Level The nominal level is the lowest level of measurement. It… Lees meer: Levels of Measurement (video)
- Writing a Research ReportA research report is a structured document that presents the findings of a study or investigation. It typically consists of several key parts, each serving a specific purpose in communicating the research process and results. The report begins… Lees meer: Writing a Research Report
- SPSS Bi-Variate Analysis
- Measures Of Central Tendency in SPSS
- SPSS Make Dataset Ready
- Quick Intro Main Functions SPSS
- Quick Overview SPSS
- Convenience SamplingConvenience sampling is a non-probability sampling method where participants are selected based on their accessibility and proximity to the researcher. When citing convenience sampling in APA format, in-text citations should include the author’s last name and the year… Lees meer: Convenience Sampling
- Min, Max and RangeIn statistics, the minimum, maximum, and range are important measures used to describe the spread of data. The minimum is the smallest value in a dataset, while the maximum is the largest value. The range, which is the… Lees meer: Min, Max and Range
- Overview Formulas StatisticsMean Median Range Variance Standard Deviation Correlation Pearson’s r Correlation Spearman’s rho t-test (Independent and Dependent) Chi-Square Test These statistical tools are fundamental for analyzing data sets, allowing researchers to summarize data, assess relationships, and test hypotheses. Citations:[1]… Lees meer: Overview Formulas Statistics
- Standard DeviationStandard deviation is a statistical measure that quantifies the amount of variation or dispersion in a set of values. In simpler terms, it indicates how much individual data points in a dataset deviate from the mean (average) value.… Lees meer: Standard Deviation
- MedianThe median is a measure of central tendency that represents the middle value in a data set when it is ordered from least to greatest. Unlike the mean, which can be heavily influenced by outliers, the median provides… Lees meer: Median
- ModeThe mode is a statistical measure that represents the most frequently occurring value in a data set. Unlike the mean or median, which require numerical calculations, the mode can be identified simply by observing which number appears most… Lees meer: Mode
- MeanThe mean, often referred to as the average, is a measure of central tendency that is widely used in statistics to summarize a set of data. It is calculated by summing all the values in a dataset and… Lees meer: Mean
- SamplingSampling is a fundamental concept in research methodology, referring to the process of selecting a subset of individuals or observations from a larger population to make inferences about the whole (Creswell & Creswell, 2018). This process is crucial… Lees meer: Sampling
- Convenience SamplingConvenience sampling is a non-probability sampling technique where participants are selected based on their ease of access and availability to the researcher, rather than being representative of the entire population (Scribbr, 2023; Simply Psychology, 2023). This method is… Lees meer: Convenience Sampling
- Chi Square testThe Chi-Square test is a statistical method used to determine if there is a significant association between categorical variables or if a categorical variable follows a hypothesized distribution. There are two main types of Chi-Square tests: the Chi-Square… Lees meer: Chi Square test
- Correlation (Scale Variables)Correlation for scale variables is often assessed using the Pearson correlation coefficient, denoted as $$ r $$, which measures the linear relationship between two continuous variables (Statology, n.d.; Scribbr, n.d.). The value of $$ r $$ ranges from… Lees meer: Correlation (Scale Variables)
- Correlation Ordinal VariablesCorrelation for ordinal variables is typically assessed using Spearman’s rank correlation coefficient, which is a non-parametric measure suitable for ordinal data that does not assume a normal distribution (Scribbr, n.d.). Unlike Pearson’s correlation, which requires interval or ratio… Lees meer: Correlation Ordinal Variables
- Reporting Significance levels (Chapter 17)Introduction In the field of media studies, understanding and reporting statistical significance is crucial for interpreting research findings accurately. Chapter 17 of “Introduction to Statistics in Psychology” by Howitt and Cramer provides valuable insights into the concise reporting… Lees meer: Reporting Significance levels (Chapter 17)
- Probability (Chapter 16)Chapter 16 of “Introduction to Statistics in Psychology” by Howitt and Cramer provides a foundational understanding of probability, which is crucial for statistical analysis in media research. For media students, grasping these concepts is essential for interpreting research… Lees meer: Probability (Chapter 16)
- Chi Square test (Chapter 15)The Chi-Square test, as introduced in Chapter 15 of “Introduction to Statistics in Psychology” by Howitt and Cramer, is a statistical method used to analyze frequency data. This guide will explore its core concepts and practical applications in… Lees meer: Chi Square test (Chapter 15)
- Unrelated t-test (Chapter14)Unrelated T-Test: A Media Student’s Guide Chapter 14 of “Introduction to Statistics in Psychology” by Howitt and Cramer (2020) provides an insightful exploration of the unrelated t-test, a statistical tool that is particularly useful for media students analyzing… Lees meer: Unrelated t-test (Chapter14)
- Related t-test (Chapter13)Introduction The related t-test, also known as the paired or dependent samples t-test, is a statistical method extensively discussed in Chapter 13 of “Introduction to Statistics in Psychology” by Howitt and Cramer. This test is particularly relevant for… Lees meer: Related t-test (Chapter13)
- Correlation (Chapter 8)Understanding Correlation in Media Research: A Look at Chapter 8 Correlation analysis is a fundamental statistical tool in media research, allowing researchers to explore relationships between variables and draw meaningful insights. Chapter 8 of “Introduction to Statistics in… Lees meer: Correlation (Chapter 8)
- Relationships Between more than one variable (Chapter 7)Exploring Relationships Between Multiple Variables: A Guide for Media Students In the dynamic world of media studies, understanding the relationships between multiple variables is crucial for analyzing audience behavior, content effectiveness, and media trends. This essay will explore… Lees meer: Relationships Between more than one variable (Chapter 7)
- Standard Deviation (Chapter 6)The standard deviation is a fundamental statistical concept that quantifies the spread of data points around the mean. It provides crucial insights into data variability and is essential for various statistical analyses. Calculation and Interpretation The standard deviation… Lees meer: Standard Deviation (Chapter 6)
- Guide SPSS How to: Calculate the Standard ErrorHere’s a guide on how to calculate the standard error in SPSS: Method 1: Using Descriptive Statistics Method 2: Using Frequencies Method 3: Using Compare Means Tips: Remember, the standard error is an estimate of how much the… Lees meer: Guide SPSS How to: Calculate the Standard Error
- Standard Error (Chapter 12)Understanding Standard Error for Media Students Standard error is a crucial statistical concept that media students should grasp, especially when interpreting research findings or conducting their own studies. This essay will explain standard error and its relevance to… Lees meer: Standard Error (Chapter 12)
- Drawing Conclusions (Chapter D10)Drawing strong conclusions in social research is a crucial skill for first-year students to master. Matthews and Ross (2010) emphasize that a robust conclusion goes beyond merely summarizing findings, instead addressing the critical “So What?” question by elucidating… Lees meer: Drawing Conclusions (Chapter D10)
- Research Proposals (Chapter B6)Research proposals play a crucial role in the social sciences, serving as a roadmap for researchers and a tool for gaining approval or funding. Matthews and Ross (2010) emphasize the importance of research proposals in their textbook “Research… Lees meer: Research Proposals (Chapter B6)
- Data Collection (Part C)Research Methods in Social Research: A Comprehensive Guide to Data Collection Part C of “Research Methods: A Practical Guide for the Social Sciences” by Matthews and Ross focuses on the critical aspect of data collection in social research.… Lees meer: Data Collection (Part C)
- Research Design (Chapter B3)Research Methods in Social Research: Choosing the Right Approach The choice of research method in social research is a critical decision that shapes the entire study. Matthews and Ross (2010) emphasize the importance of aligning the research method… Lees meer: Research Design (Chapter B3)
- Choosing Method(Chapter B4)The choice of research method in social research is a critical decision that shapes the entire research process. Matthews and Ross (2010) emphasize the importance of aligning research methods with research questions and objectives. This alignment ensures that… Lees meer: Choosing Method(Chapter B4)
- Guide SPSS How to: Calculate ANOVAHere’s a step-by-step guide for 1st year students on how to calculate ANOVA in SPSS: Step 1: Prepare Your Data Step 2: Run the ANOVA Step 3: Additional Options Step 4: Post Hoc Tests Step 5: Run the… Lees meer: Guide SPSS How to: Calculate ANOVA
- Guide SPSS How to: Calculate the dependent t-testHere’s a guide for 1st year students on how to calculate the dependent t-test in SPSS: Step-by-Step Guide for Dependent t-test in SPSS 1. Prepare Your Data 2. Open SPSS and Enter Data 3. Run the Test 4.… Lees meer: Guide SPSS How to: Calculate the dependent t-test
- Guide SPSS How to: Calculate the independent t-testStep-by-Step Guide Interpreting the Results Tips
- Guide SPSS How to: Calculate Chi SquareInterpreting the Results Main Weakness of Chi-square Test The main weakness of the Chi-square test is its sensitivity to sample size[3]. Specifically: To address this weakness, always check the “Expected Count” in your output to ensure the assumption… Lees meer: Guide SPSS How to: Calculate Chi Square
- Guide SPSS how to: Measures of Central Tendency and Measures of DispersionHere’s a guide for 1st year students to calculate measures of central tendency and dispersion in SPSS: Calculating Measures of Central Tendency Calculating Measures of Dispersion Interpreting the Results Choosing the Appropriate Measure Remember, if your distribution is… Lees meer: Guide SPSS how to: Measures of Central Tendency and Measures of Dispersion
- Anova and ManovaExploring ANOVA and MANOVA Techniques in Marketing and Media Studies Analysis of Variance (ANOVA) and Multivariate Analysis of Variance (MANOVA) are powerful statistical tools that can provide valuable insights for marketing and media studies. Let’s explore these techniques… Lees meer: Anova and Manova
- Reviewing Literature (Chapter B2)Understanding Literature Reviews in Social Research(Theoretical Framework) A literature review is a crucial part of any social research project. It helps you build a strong foundation for your research by examining what others have already discovered about your… Lees meer: Reviewing Literature (Chapter B2)
- Chi SquareChi-square is a statistical test widely used in media research to analyze relationships between categorical variables. This essay will explain the concept, its formula, and provide an example, while also discussing significance and significance levels. Understanding Chi-Square Chi-square… Lees meer: Chi Square
- Correlation Spearman and PearsonCorrelation is a fundamental concept in statistics that measures the strength and direction of the relationship between two variables. For first-year media students, understanding correlation is crucial for analyzing data trends and making informed decisions. This essay will… Lees meer: Correlation Spearman and Pearson
- Concepts and VariablesConcepts and variables are important components of scientific research (Trochim, 2006). Concepts refer to abstract or general ideas that describe or explain phenomena, while variables are measurable attributes or characteristics that can vary across individuals, groups, or situations.… Lees meer: Concepts and Variables
- Immersiveness Measuring with ScalesImmersiveness is a key aspect of film that refers to the degree to which viewers feel engaged and absorbed in the cinematic experience (Tamborini, Bowman, Eden, & Grizzard, 2010). Measuring immersiveness in film can be challenging, as it… Lees meer: Immersiveness Measuring with Scales
- Cultivation TheoryCultivation theory is a theoretical framework in the field of media studies that explains how long-term exposure to media can shape people’s perceptions of reality. According to this theory, the more an individual is exposed to media content,… Lees meer: Cultivation Theory
- ObservationObservation is one of the most commonly used research methods in media studies. It involves collecting data by watching and recording the behavior and interactions of people in specific situations. Observations can take many forms, including participant observation,… Lees meer: Observation
- ValidityValidity is a fundamental concept in research, particularly in media studies, which involves analyzing various forms of media, such as film, television, print, and digital media. In media studies, validity refers to the extent to which a research… Lees meer: Validity
- Concepts and VariablesConcepts and variables are two key terms that play a significant role in media studies. While the two terms may appear similar, they serve distinct purposes and meanings. Understanding the differences between concepts and variables is essential for… Lees meer: Concepts and Variables
- Type I and Type II errorsType I and Type II errors are two statistical concepts that are highly relevant to the media industry. These errors refer to the mistakes that can be made when interpreting data, which can have significant consequences for media… Lees meer: Type I and Type II errors
- TransperancyTransparency in research is a vital aspect of ensuring the validity and credibility of the findings. A transparent research process means that the research methods, data, and results are openly available to the public and can be easily… Lees meer: Transperancy
- Tip Sheet Research PaperYou may read this TIP Sheet from start to finish before you begin your paper, or skip to the steps that are causing you the most grief. 1. Choosing a topic: Interest, information, and focusYour job will be… Lees meer: Tip Sheet Research Paper
- Sampling ErrorSampling error is a statistical concept that occurs when a sample of a population is used to make inferences about the entire population, but the sample doesn’t accurately represent the population. This can happen due to a variety… Lees meer: Sampling Error
- ReplicabiltyReplicability is a key aspect of scientific research that ensures the validity and reliability of results. In media studies, replicability is particularly important because of the subjective nature of many of the topics studied. This essay will discuss… Lees meer: Replicabilty
- APA StyleAPA 7 style is a comprehensive formatting and citation system widely used in academic and professional writing. This essay will cover key aspects of APA 7, including in-text referencing, reference list formatting, and reporting statistical results, tables, and… Lees meer: APA Style
- PlagiarismEven though most student plagiarism is probably unintentional, it is in students’ best interests to become aware that failing to give credit where it is due can have serious consequences. For example, at Butte College, a student caught… Lees meer: Plagiarism
- Inductive versus DeductiveAs a media student, you are likely to come across two primary research methods: inductive and deductive research. Both approaches are important in the field of media research and have their own unique advantages and disadvantages. In this… Lees meer: Inductive versus Deductive
- How to use citations in your researchAccording to Jenkins (2006), “convergence culture represents a shift in the relations between media and culture, as consumers take control of the flow of media” (p. 2). In her book The Presentation of Self in Everyday Life, Goffman… Lees meer: How to use citations in your research
- Examples of Measurement ToolsIn media studies, it is important to choose the appropriate measurement tools to gather data on attitudes, perceptions, brain activity, and arousal. Here are some potential measurement tools that can be used to gather data in each of… Lees meer: Examples of Measurement Tools
- Developing a thesis and supporting argumentsThere’s something you should know: Your college instructors have a hidden agenda. You may be alarmed to hear this-yet your achievement of their “other” purpose may very well be the most important part of your education. For every… Lees meer: Developing a thesis and supporting arguments
- First StepAs a student, you may be required to conduct research for a project, paper, or presentation. Research is a vital skill that can help you understand a topic more deeply, develop critical thinking skills, and support your arguments… Lees meer: First Step
- Theories, Models and ConceptsTheories, Models, and Concepts in Media and Marketing In the realm of media and marketing, understanding theories, models, and concepts is crucial for developing effective strategies. These constructs provide a framework for analyzing consumer behavior, crafting strategies, and… Lees meer: Theories, Models and Concepts
- Result Presentation (Chapter E1-E3)Chapter E1-E3 Matthews and Ross Presenting research results effectively is crucial for communicating findings, influencing decision-making, and advancing knowledge across various domains. The approach to presenting these results can vary significantly depending on the setting, audience, and purpose.… Lees meer: Result Presentation (Chapter E1-E3)
- Shapes of Distributions (Chapter 5)Probability distributions are fundamental concepts in statistics that describe how data is spread out or distributed. Understanding these distributions is crucial for students in fields ranging from social sciences to engineering. This essay will explore several key types… Lees meer: Shapes of Distributions (Chapter 5)
- Check List SurveyAlignment with Research Objectives Question Relevance and Specificity Comprehensiveness Logical Flow and Structure Data Quality and Usability Respondent Engagement Clarity and Comprehension Bias Mitigation Measurement Precision Validity Checks Adaptability and Flexibility Actionability of Results Ethical Considerations
- How to Create a SurveyWhat is a great survey? A great online survey provides you with clear, reliable, actionable insight to inform your decision-making. Great surveys have higher response rates, higher quality data and are easy to fill out. Follow these 10 tips to… Lees meer: How to Create a Survey
- Univariate Analysis: Understanding Measures of Central Tendency and DispersionUnivariate analysis is a statistical method that focuses on analyzing one variable at a time. In this type of analysis, we try to understand the characteristics of a single variable by using various statistical techniques. The main objective… Lees meer: Univariate Analysis: Understanding Measures of Central Tendency and Dispersion
- Methods of Conducting Quantitative ResearchQuantitative research is a type of research that uses numerical data and statistical analysis to understand and explain phenomena. It is a systematic and objective method of collecting, analyzing, and interpreting data to answer research questions and test… Lees meer: Methods of Conducting Quantitative Research
- Bivariate Analysis: Understanding Correlation, t-test, and Chi Square testBivariate analysis is a statistical technique used to examine the relationship between two variables. This type of analysis is often used in fields such as psychology, economics, and sociology to study the relationship between two variables and determine… Lees meer: Bivariate Analysis: Understanding Correlation, t-test, and Chi Square test
- Developing a HypothesisA hypothesis is a statement that predicts the relationship between two or more variables. It is a crucial step in the scientific process, as it sets the direction for further investigation and helps researchers to determine whether their… Lees meer: Developing a Hypothesis
- DistributionsWhen working with datasets, it is important to understand the central tendency and dispersion of the data. These measures give us a general idea of how the data is distributed and what its typical values are. However, when… Lees meer: Distributions
- Example setup Experimental DesignExperimental design is a crucial aspect of media studies research, as it allows researchers to test hypotheses about media effects and gain insights into the ways that media affects individuals and society. In this blog post, we will… Lees meer: Example setup Experimental Design
- Experimental DesignExperiments are a fundamental part of the scientific method, allowing researchers to systematically investigate phenomena and test hypotheses. Setting up an experiment is a crucial step in the process of conducting research, and it requires careful planning and… Lees meer: Experimental Design
- Cross Sectional Designhow to set up a cross-sectional design in quantitative research in a media-related context: Research Question: What is the relationship between social media use and body image satisfaction among teenage girls?
- Example Before and After StudyResearch question: Does watching a 10-minute news clip on current events increase media literacy among undergraduate students? Sample: Undergraduate students who are enrolled in media studies courses at a university Before measurement: Administer a pre-test to assess students’… Lees meer: Example Before and After Study
- Independent t-testThe independent t-test, also known as the two-sample t-test or unpaired t-test, is a fundamental statistical method used to assess whether the means of two unrelated groups are significantly different from one another. This inferential test is particularly… Lees meer: Independent t-test
- Podcast
- Longitudinal Quantitative ResearchObserving Change Over Time Longitudinal research is a powerful research design that involves repeatedly collecting data from the same individuals or groups over a period of time, allowing researchers to observe how phenomena change and develop. Unlike cross-sectional… Lees meer: Longitudinal Quantitative Research
- Cohort StudyA cohort study is a specific type of longitudinal research design that focuses on a group of individuals who share a common characteristic, often their age or birth year, referred to as a cohort. Researchers track these individuals… Lees meer: Cohort Study